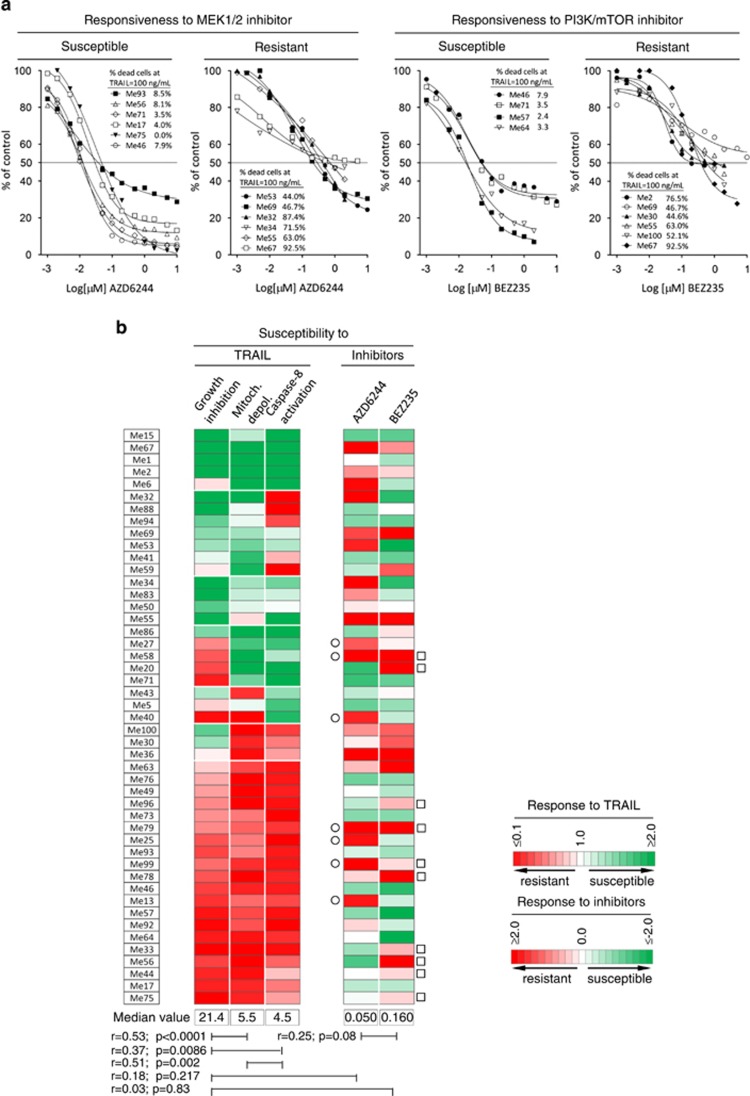
Figure 1.
Independent susceptibility profiles of melanoma cells to MEK, PI3K/mTOR inhibitors and TRAIL. (a) Responsiveness of selected melanoma cell lines to AZD6244, BEZ235 and TRAIL, by MTT assay. (b) Cell viability (by MTT assay), mitochondrial depolarization (by TMRE assay) and caspase-8 cleavage (by flow cytometry) in response to TRAIL (100 ng/ml, 48 h) shown by a color code indicating the ratio of the values for each tumor to the median value of each parameter in the whole panel of cell lines. Responsiveness to AZD6244 and BEZ235 (by MTT assay, 48 h) shown by a color code indicating the log-transformed ratio of the IC50 of each tumor to the median IC50 of each inhibitor in the whole panel. Data clustered by the three parameters in response to TRAIL. Statistical analysis by Spearman correlation analysis. TRAIL-resistant melanoma cell lines with IC50 to AZD6244 (○) or to BEZ235 (□) >0.2 μM

