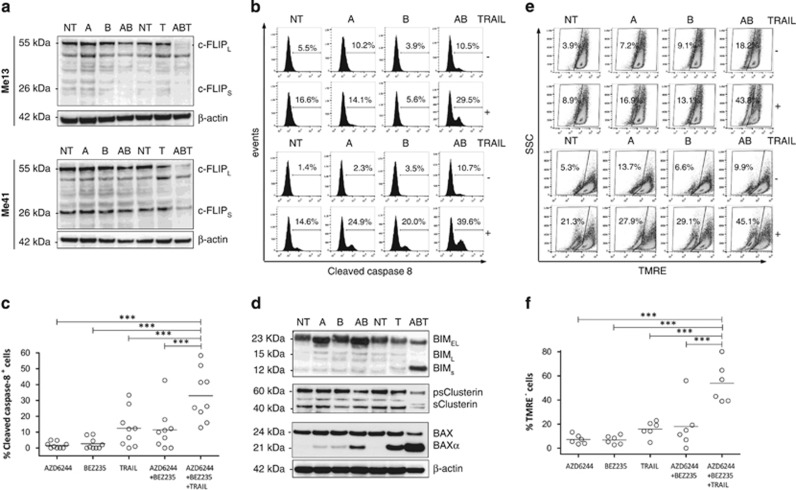
Figure 4.
Modulation of pro- and anti-apoptotic molecules by melanoma treatment with target-specific inhibitors, TRAIL and their combination. (a) Western blotting analysis for c-FLIP expression and (b) flow cytometry analysis for cleaved caspase-8 in two melanoma cell lines (Me13 and Me41) treated with AZD6244 (A), BEZ235 (B), TRAIL (T) or the indicated combinations. (c) Cleaved caspase-8 analysis in a panel of nine cell lines. (d) Western blotting analysis for expression of BIM, clusterin and BAX in Me13 cells treated as in panel (a). (e) TMRE analysis for mitochondrial depolarization in two melanoma cell lines (Me 13 and Me 41) treated as in panel (a). (f) TMRE assay in a panel of six melanoma cell lines. The numbers in flow cytometry panels in (b) and (e) indicate the percentage of caspase-8+ cells and the percentage of TMRE− cells, respectively. Statistical analysis in panels (c and f) by ANOVA followed by SNK test; ***P<0.001

