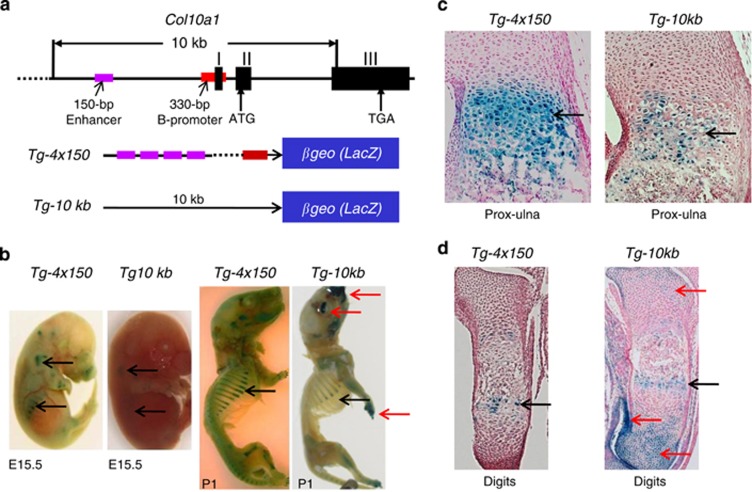
Figure 1.
Detailed analysis of Tg-4x150 and Tg-10 kb TG reporter mice. (a) Top panel displays Col10a1 gene structure and the 10 -kb promoter and intronic element. Positions of the 150-bp (−4296 to −4147 bp) Col10a1 cis-enhancer (purple bar) and its 330-bp (−220 to +110 bp) basal promoter (red bar) are shown. Bottom panel shows the different Col10a1 promoter/enhancer element to drive the LacZ reporter gene. (b) X-gal staining and comparison between TG mice Tg-4x150 and Tg-10 kb at both E15.5 (left panel) and P1 (right panel) stages. Much stronger and more specific staining was detected in Tg-4x150 mice, whereas Tg-10 kb mice show extra nonspecific staining in digits and craniofacial region (red arrows). (c) Histochemical analysis of the limb sections (proximal ulna) confirmed much stronger blue staining in the hypertrophic zone of Tg-4x150 mice than in Tg-10 kb mice (black arrows). (d) Analysis of the digit sections detect extra nonspecific blue staining in resting chondrocytes of Tg-10 kb mice (red arrows), but not in Tg-4x150 mice

