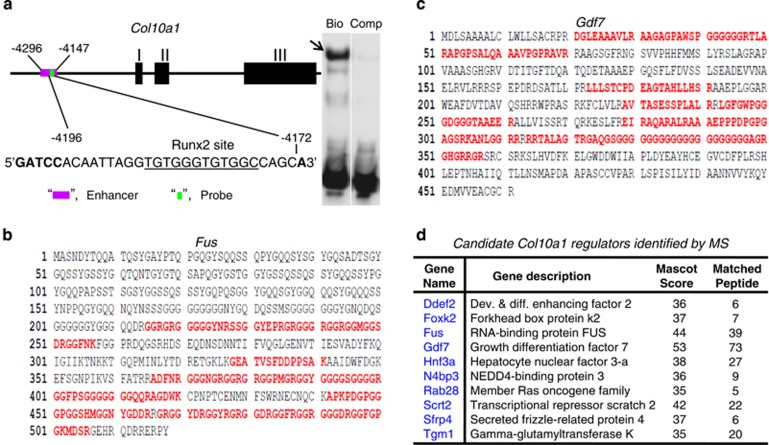
Figure 4.
Mass spectrometry analysis of specific DNA/protein complex. (a) Position and sequence of the DNA probe from the enhancer region are shown.38 Bio-tin labeled cis-element containing the Runx2 site (underlined) can form specific complex with hypertrophic MCT cell nuclear extracts (arrow), whereas no binding complex was observed when using the unlabeled competitive control. (b) Fus was identified as it met the criteria for protein identification, that is MASCOT >=35 with >=5 matched peptides (red letters). (c) Gdf7 also meets the criteria for protein identification. (d) Partial list of genes that encode proteins and meet the criteria for protein identification. These include genes Ddef2, Foxk2, Fus, Gdf7, Hnf3a, N4bp3, Rab28, Scrt2, Sfrp4 and Tgm1. Gdf7 has the highest (53) MASCOT score with the most (73) matched peptides

