Figure 5.
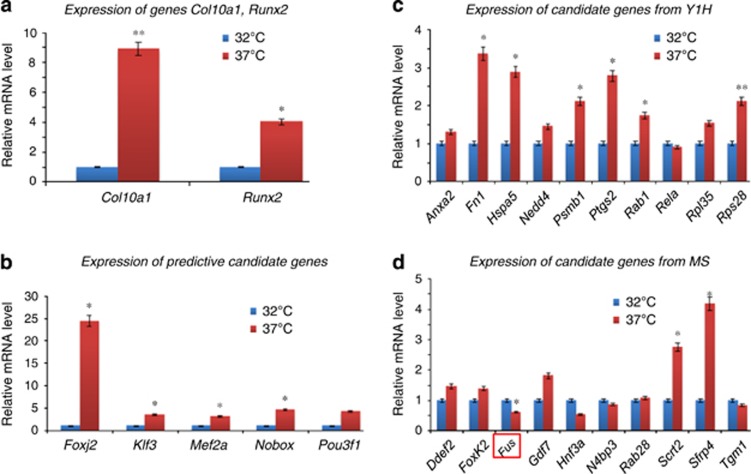
Expression analysis of candidate genes in MCT cells. (a) qRT-PCR was performed to examine the mRNA transcript level of marker genes Col10a1 and Runx2 in MCT cells. As illustrated, both Col10a1 (8.8-fold, P=0.009) and Runx2 (4.0-fold, P=0.04) are significantly upregulated in hypertrophic MCT cells compared with that in proliferative MCT cells. *P<0.05; **P<0.01. (b) Five candidate genes (Foxj2, Klf3, Mef2a, Nobox and Pou3f1) identified by Match program were examined. Except for Pou3f1 (3.9-fold, P=0.06), all other genes examined show significant upregulation in hypertrophic MCT cells. *P<0.05. (c) Ten candidate genes identified by Y1H were selected and examined. Genes Fn1, Hspa5, Psmb1, Ptgs2, Rab1 and Rps28 are significant upregulated in hypertrophic MCT cells, while others (Anxa2, Nedd4, Rela and Rpl35) showed no difference between hypertrophic and proliferative MCT cells. *P<0.05; **P<0.01. (d) Ten candidate genes identified by MS were also selected and examined. Genes Scrt2 (2.8-fold, P=0.024) and Sfrp4 (4.2-fold, P=0.029) showed significant upregulation, whereas Fus was significantly downregulated (0.6-fold, P=0.041) in hypertrophic MCT cells. Genes (Ddef2, FoxK2, Gdf7, Hnf3a, N4bp3, Rab28 and Tgm1) showed no difference between hypertrophic and proliferative MCT cells. *P<0.05

