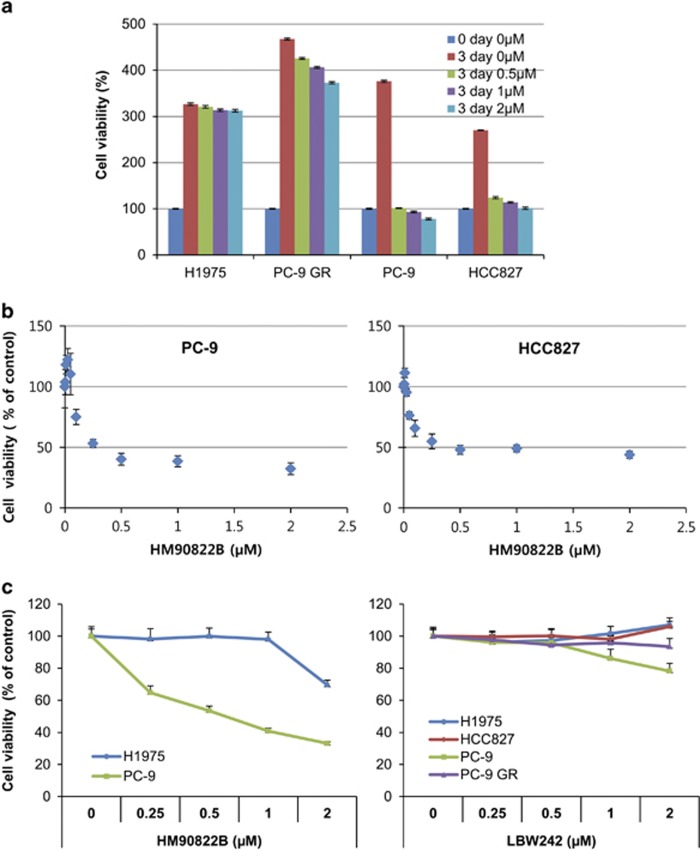
Figure 3.
The effect of HM90822B on NSCLC cell growth. Cells were treated with increasing concentrations of HM90822B (up to 2 μM). Cell proliferation was determined by MTT assay. The absorbance was measured on an ELISA plate reader (Molecular Devices) at a wavelength of 540 nm, and the inhibitory effects were normalized to untreated condition. (a) Growth graphs of NSCLC cells harboring mutant EGFR (H1975, PC-9 GR, HCC827 and PC-9). Cells were treated with increasing concentrations of HM90822B (up to 2 μM) for 3 days. (b) Growth graphs of NSCLC cells harboring mutant EGFR sensitive to TKIs (HCC827 and PC-9). Cells were treated with increasing concentrations of HM90822B (up to 2 μM) for 1 day. (c) Growth graphs of NSCLC cells. Cells were treated with increasing concentrations of HM90822B (up to 2 μM) or LBW242 (up to 2 μM) for 1 day

