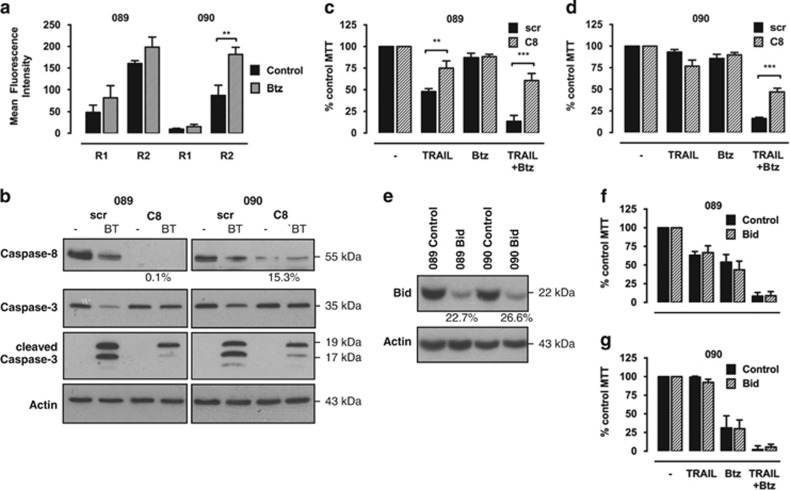
Figure 3.
Bortezomib-induced sensitisation involves upregulation of DR5 and is mediated by caspase-8 but not Bid. (a) The 089 and 090 cells were treated with 2.5 ng/ml bortezomib (Btz) for 20 h. The surface expression of TRAIL-Rs was assessed by flow cytometry following staining with monoclonal antibodies for TRAIL-R1 (DR4) or TRAIL-R2 (DR5) and a secondary anti-mouse fluorescein isothiocyanate (FITC)-coupled antibody. Bars represent mean fluorescence intensity of FITC corrected for staining with a nonspecific isotype control and error bars indicate S.E.M. of three independent experiments. P-values were determined by one-way analysis of variance (ANOVA) (**P<0.01). (b) Stable inducible 089 and 090 caspase-8 (C8) and scrambled control (scr) short hairpin RNA (shRNA) cells were generated by lentiviral infection and shRNAs were induced with 1 μg/ml doxycycline for 24 h. Caspase-3 and -8 levels following treatment with 50 ng/ml TRAIL and 2.5 ng/ml bortezomib (BT) for 16 h were assessed by western blot analysis compared with respective control cells. The efficiency of caspase-8 knockdown was calculated using ImageJ software normalised to β-actin. Blots were cut and combined at the indicated line. (c and d) Cell viability of 089 (c) and 090 (d) C8 and scr shRNA cells after induction with 1 μg/ml doxycycline in the presence of 50 ng/ml TRAIL and/or 1 ng/ml Btz was analysed by 3-(4,5-dimethythiazol-2-yl)-2,5-diphenyl tetrazolium bromide (MTT) assay after 48 h of treatment. Bars represent mean cell viability normalised to untreated control cells and error bars indicate S.E.M. of three independent experiments. P-values were determined by two-way ANOVA comparing C8 shRNA with corresponding control cells (**P<0.01 and ***P<0.001). (e) Stable Bid and non-silencing control shRNA 089 and 090 cells were generated by lentiviral infection. The efficiency of Bid knockdown in both cell lines was assessed by western blot analysis compared with respective control cells and calculated using ImageJ software normalised to β-actin. (f and g) Cell viability of 089 (f) and 090 (g) Bid and control shRNA cells in the presence of 50 ng/ml TRAIL and/or 1 ng/ml Btz as indicated was analysed by MTT analysis after 48 h. Bars represent mean cell viability normalised to untreated control cells and error bars indicate S.E.M. of three independent experiments

