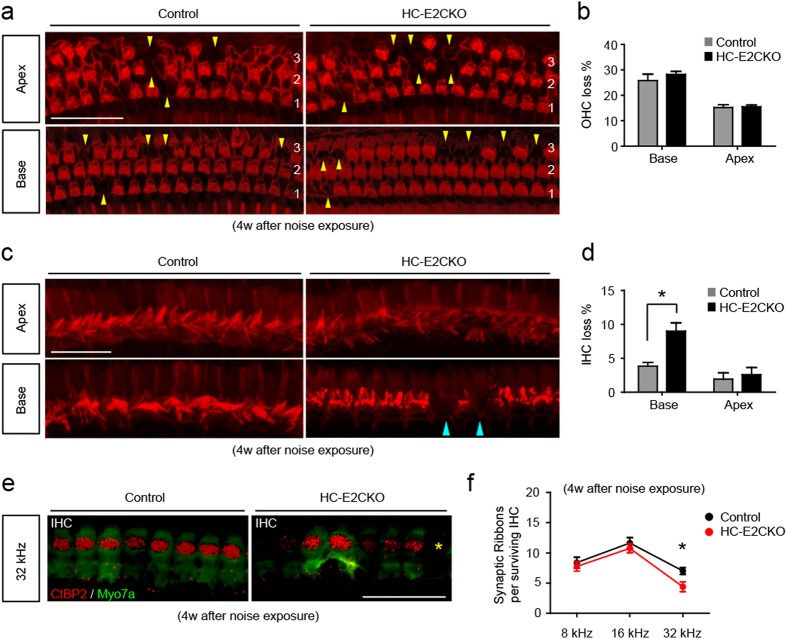
Figure 6. HC-E2CKO mice showed more IHC loss compared with controls after noise exposure.
(a) Images of OHCs in control and HC-E2CKO mice at 4 weeks after noise exposure. HC-E2CKO mice had OHCs loss (yellow) comparable to control mice. 1, 2, 3: 1st, 2nd, and 3rd rows of OHCs. Scale bar, 50 μm. (b) The ratio of missing to whole OHCs is expressed as a percentage. No significant differences were observed in OHCs loss between the groups (n = 6 in each group). (c) Images of IHCs in control and HC-E2CKO mice at 4 weeks after noise exposure. In the base, HC-E2CKO mice had more IHC loss (blue) compared to control mice. Scale bar, 25 μm. (d) The ratio of missing to whole IHCs is expressed as a percentage. A significant loss of IHCs was observed at the base in HC-E2CKO mice compared with control mice (n = 6 in each group). (e) Whole mount preparations were stained with myosin7a (green) and CtBP2 (red). HC-E2CKO mice showed loss (yellow asterisks) of IHCs and synaptic ribbons. IHC, inner hair cell; Myo7a, myosin7a. Scale bar, 20 μm. (f) The number of synaptic ribbons per surviving IHC at 32 kHz was significantly decreased in HC-E2CKO mice (n = 4 in each group). Error bars show SE. (Mann-Whitney U-test, *p < 0.05).

