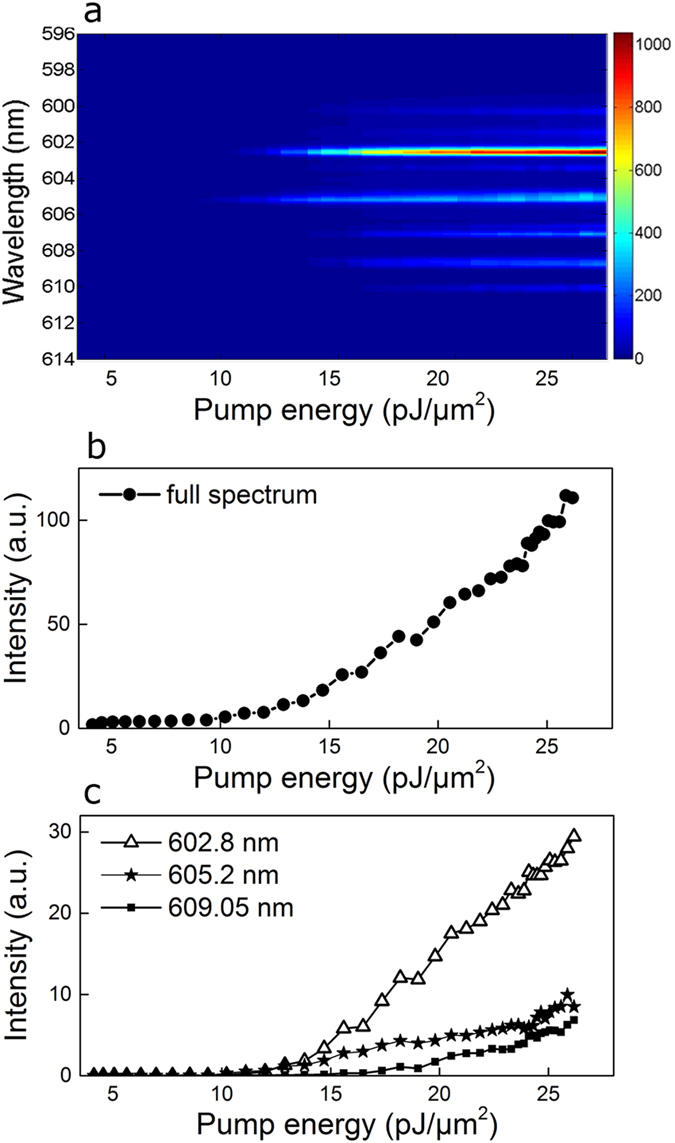
Figure 3. Pump dependent emission spectrum.

Measured spectra as a function of the pump energy (a). Total detected intensity integrated over the frequency range of measurement (b). Peak intensity of three modes at 602.8 nm (triangles), 605.2 nm (star symbol) and 609.05 nm (full squares), as a function of the pump energy (c).
