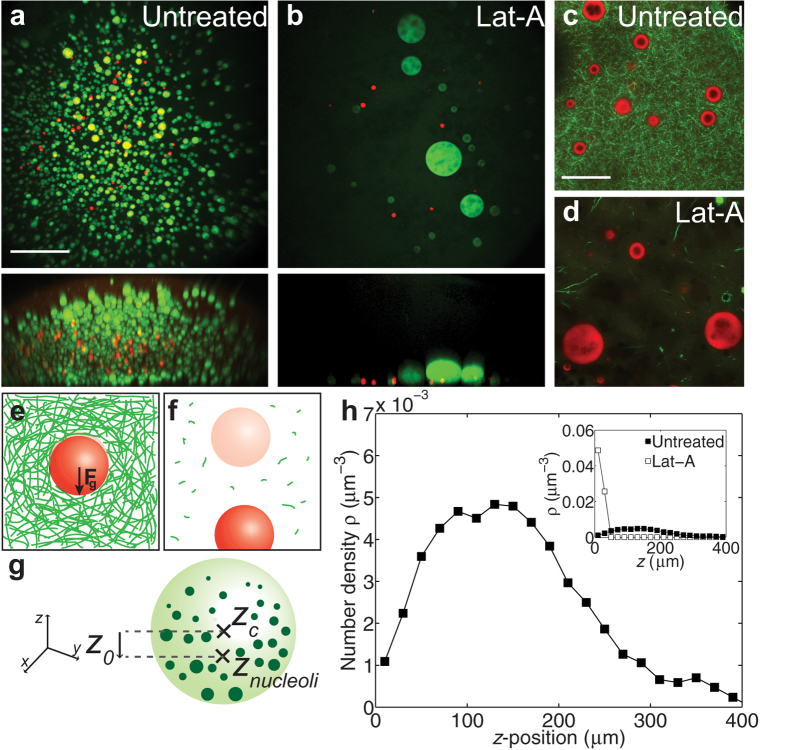
Figure 1. Non-uniform distribution of nuclear bodies is dependent on a nuclear actin meshwork.
(a,b) Top images are maximum intensity XY projections of the entire nucleus containing nucleoli labeled with NPM1::GFP (green) and HLBs labeled with TagRFP::coilin (red); bottom images are maximum intensity XZ projections. Scale bar = 100 μm. (a) An emulsion of nuclear bodies is stabilized by a nuclear actin network. (b) A few massive nuclear bodies are found at the bottom  -plane after actin disruption by Lat-A. (c,d) XY views of Lifeact::GFP labeled actin network (green) and NPM1::RFP labeled nucleoli (red) in untreated (c) and Lat-A treated nuclei (d). Scale bar = 20 μm. (e) Schematic showing how a nuclear body (red) is subjected to a downward gravitational force, but is held in place by an actin network (green). (f) Disruption of the actin network results in nuclear body sedimentation. Faded sphere represents initial position. (g) Schematic illustrating the distance, z0, as the difference from the center of the nucleolar distribution, znucleoli, and the centroid of the nucleus, zc. (h) The normalized number density, as a function of vertical z-position, where the lowest
  -position,
  = 0, corresponds to the bottom of the native nucleus (n = 43 nuclei). Inset contains comparison of normalized number density as a function of
  -position for untreated nuclei (filled symbols) and Lat-A treated nuclei (unfilled symbols) (n = 12 nuclei).

