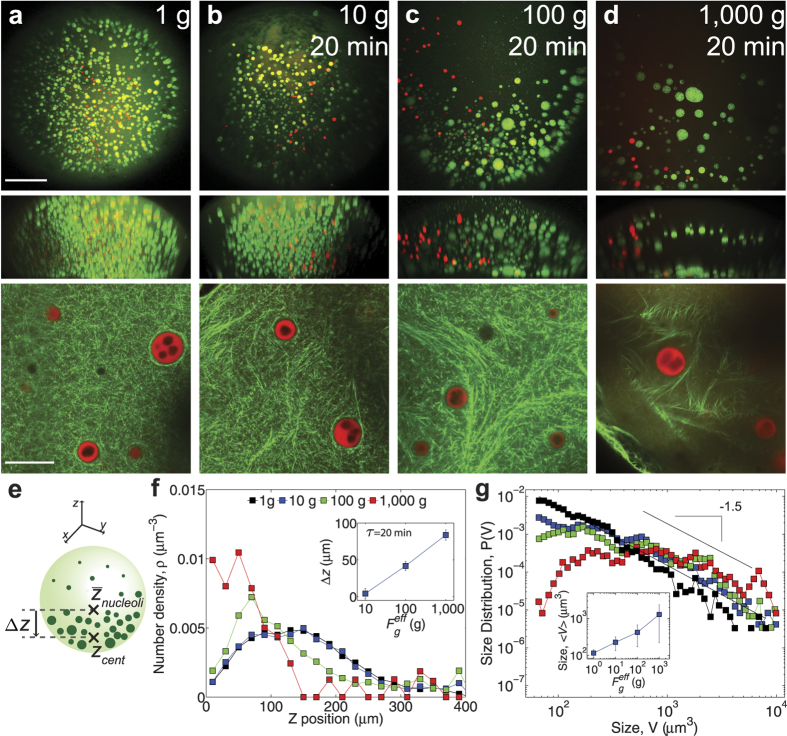
Figure 4. Centrifugation changes nuclear body spatial and size distributions in a force dependent manner.
(a–d) Top images are maximum intensity XY projections of the entire nucleus containing nucleoli labeled with NPM1::GFP (green) and HLBs labeled with TagRFP::coilin (red); middle images are maximum intensity XZ projections of the same nucleus; and bottom images are XY views of the Lifeact::GFP labeled actin network with NPM1::RFP labeled nucleoli. For top and middle rows, scale bar = 100 μm, and for bottom row, scale bar = 20 μm. (a) The untreated nucleus contains suspended nuclear bodies at 1 g. For (b–d), the nucleus was centrifuged at 10 g (n = 21 nuclei), 100 g (n = 22 nuclei), or 1,000 g (n = 15 nuclei), for twenty minutes, respectively and nuclear bodies and nuclear actin were subsequently imaged. (e) Schematic illustrating relative displacement, Δz, between the average center of the nucleolar distribution in the native nucleus,  , and the average center of the nucleolar distribution after centrifugation,
  . (f) The normalized number density, as a function of vertical
  -position of nucleoli, where the lowest
  -position,
  = 0, corresponds to the bottom of the nucleus for untreated nuclei (black) and nuclei centrifuged at 10 g (blue), 100 g (green), and 1,000 g (red) for twenty minutes. Inset shows the relative sedimentation displacement, Δz, as a function of the applied gravitational force. Error bars represent s.e.m. (g) The normalized probability distribution of nucleolus size (volume) for untreated nuclei (black) and nuclei centrifuged at 10 g (blue), 100 g (green), and 1,000 g (red) for twenty minutes. Solid line shows a slope of −1.5, indicative of power-law observed in native nuclei. Inset shows the average size of nucleoli vs. applied gravitational force. Error bars represent s.e.m.

