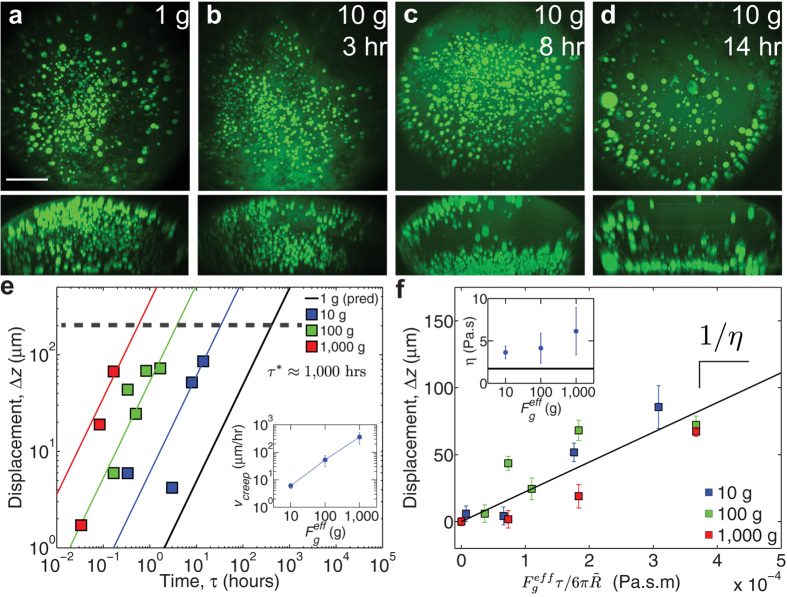
Figure 5. Spatial distributions evolve in time, consistent with creep behavior.
(a–d) Top images are maximum intensity XY projections of the entire nucleus containing nucleoli labeled with NPM1::GFP (green); bottom images are maximum intensity XZ projections of same nuclei. Scale bar = 100 μm. (a) The untreated nucleus at 1 g. For (b–d), the nucleus was centrifuged at 10 g for 3 hours (n = 14 nuclei), 8 hours (n = 9 nuclei), and 14 hours (n = 9 nuclei), respectively. (e) The relative sedimentation displacement, Δz, as a function of centrifugation time at centrifugation forces of 10 g (blue), 100 g (green), and 1,000 g (red). Error bars represent s.e.m. Black solid line presents prediction at 1 g using Stokes law and average viscosity determined from centrifugation experiments. Dashed line represents a distance of 200 μm, representing the radius of the nucleus. Inset shows the creep velocity as function of effective gravitational force for 10 g, 100 g and 1,000 g. Error bars represent 95% confidence interval from the fit. (f) The relative sedimentation displacement, Δz, as a function of the scaled force for centrifugation forces of 10 g (blue), 100 g (green), and 1,000 g (red). Error bars represent s.e.m. Black solid line is the best-fit line for the data, and the slope is the inverse of the viscosity. Inset shows the viscosity individually determined for effective gravitational forces with error bars representing 95% confidence interval. Black solid line indicates the viscosity determined from the creep compliance fit by the viscoelastic model (Fig. 3b).

