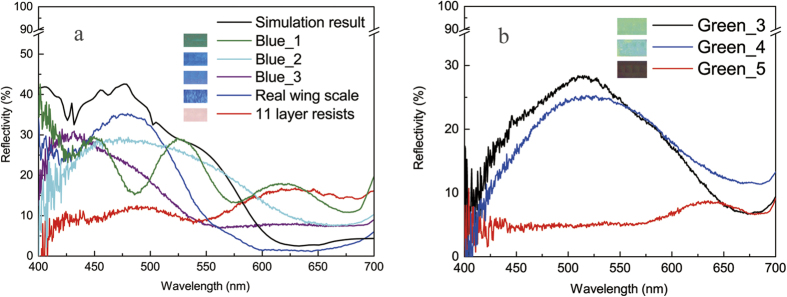
Figure 6. The measured and the simulated reflectance spectra.
(a) The reflectivity from the naturel, the fabricated and the simulated wing scales with blue color. The displayed colors in the inset are from microscope images. (b) The reflectivity from the fabricated scales with green color. The sample names and their corresponding colors are shown in the inset. The red line with low reflectivity was taken from a ridge grating without PMMA/Air branches. Its color is dark red at 620 nm. For detailed explanations, see the text.

