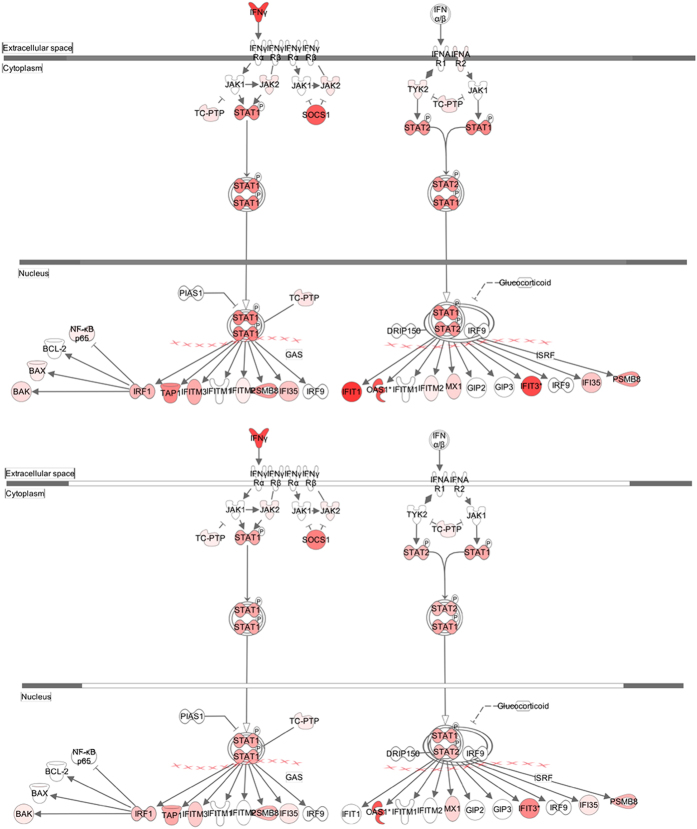
Figure 4. Pathway analysis for interferon signalling at 3 days post infection (dpi).
Pathway analysis with IPA software allowed identification of pathways that were differentially expressed between H5N1- and H5N8- infected mice. Genes associated with the interferon signalling canonical pathway that showed differential expression are highlighted in colour. Colour intensity indicates the degree of upregulation (red) or downregulation (green) relative to the mock-infected mice. Solid lines represent direct interactions and dashed lines indirect interactions.

