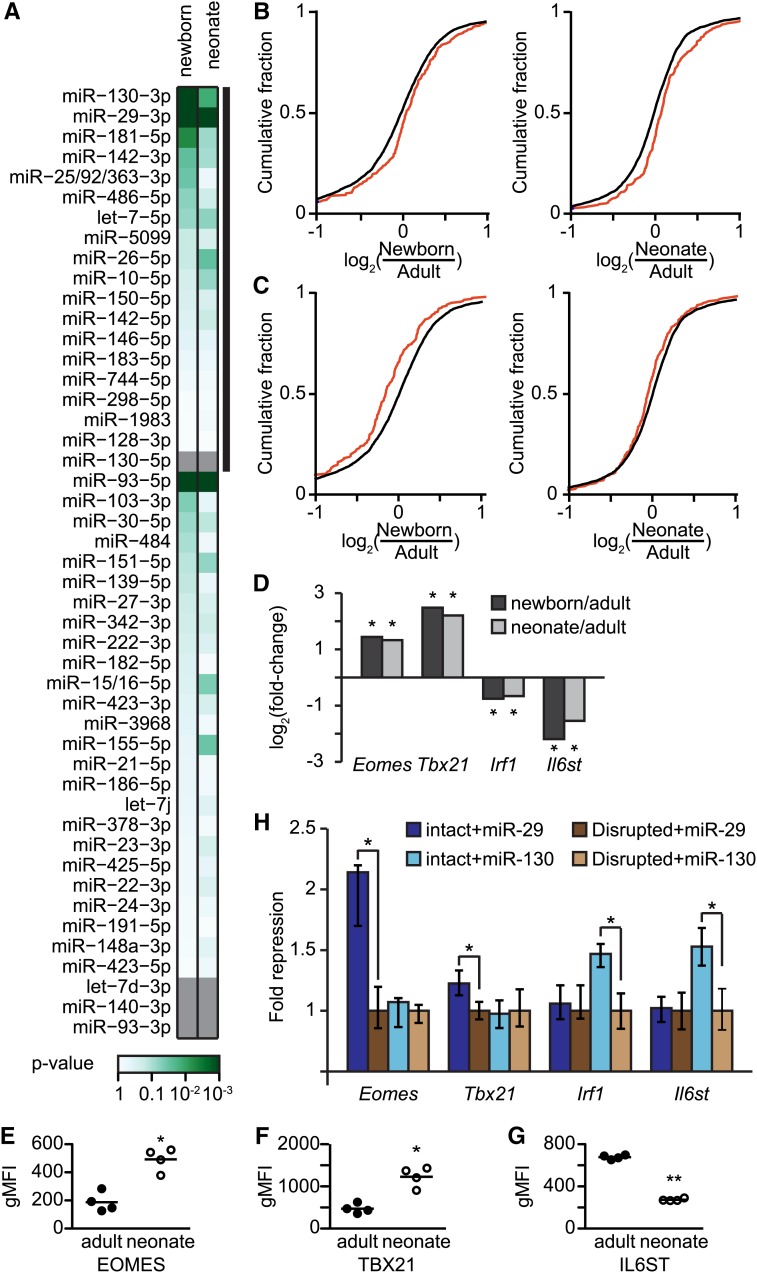
Figure 4.
miRNA targets. (A) Significant differences in miRNA target expression. Fold-change differences in expression between adults and neonates (or newborns) were found for predicted targets of each miRNA expressed in CD8+ T cells, which were then compared to fold changes in expression of a background set. Differentially expressed miRNAs are indicated with a thick black line, and miRNAs without predicted targets are shown in gray. Significance was determined by Kolmogorov–Smirnov tests. All samples consist of two pooled biological replicates; see also File S4. (B and C) Cumulative fold-change differences in expression of newborns (left) and neonates (right) compared to adults is shown for background genes (black) and targets (red) of miR-29 (B, P < 10−4) and miR-130 (C, P < 0.05). Expression values for targets are the mean Fragments Per Kilobase of transcript per Million mapped reads (FPKM) values of two pooled biological replicates. (D) Mean differences in expression for neonate or newborn FPKM value compared to the adult value. Benjamini–Hochberg corrected significant differential expression was determined using CuffDiff. *P < 0.05 (E–G) Differences in protein expression between naive adult and neonatal samples as determined by flow cytometry for EOMES (E), TBX21 (F), and IL6ST (G). Significance determined by unpaired t-test, *P < 0.01, **P < 0.0001; see also Figure S6. (H) Fold repression of putative miRNA targets. The luciferase activity of reporter constructs containing intact miRNA target sites was normalized to otherwise identical reporters with disrupted target sites in the presence of miR-29 or miR-130. Reporter data plotted as fold repression (y-axis) of reporters with intact sites relative to those with disrupted sites. Data are represented as the geometric mean ± 33% of the spread of the data; n = 12–18; significance was determined by a two-sided Wilcoxon rank-sum test; *P < 0.0005.

