Figure 5.
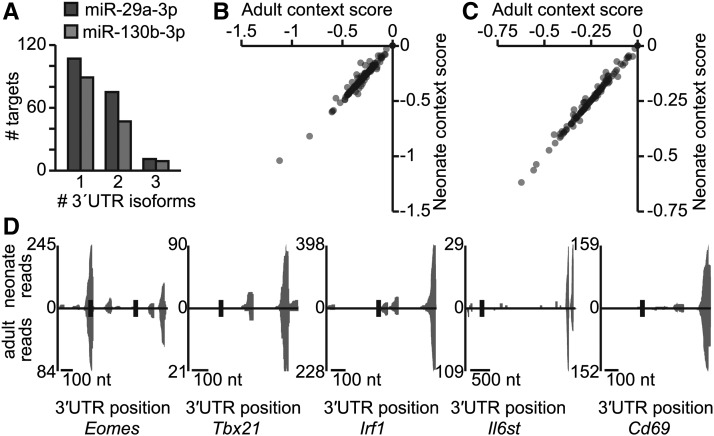
3′ UTR isoforms in naive CD8+ T cells. (A) The number of 3′-UTR isoforms expressed in adult and neonatal naive cells for miR-29 and miR-130 targets, as determined by 3′ Seq. The naive adult data are derived from two pooled biological replicates; the naive neonate has one replicate; see also File S5. (B and C) Isoform-weighted context scores for predicted targets of miR-29 (B) and miR-130 (C), comparing adult and neonatal samples (Pearson correlation coefficients > 0.98; P < 10−15 for targets of both miR-29 and miR-130). Context scores were weighted by the percentage of isoforms that contain each miRNA target; see also Figure S7. (D) Gene models shown with miRNA target sites in black, and density of 3′ Seq reads corresponding to 3′ termini of different isoforms.

