Figure 6.
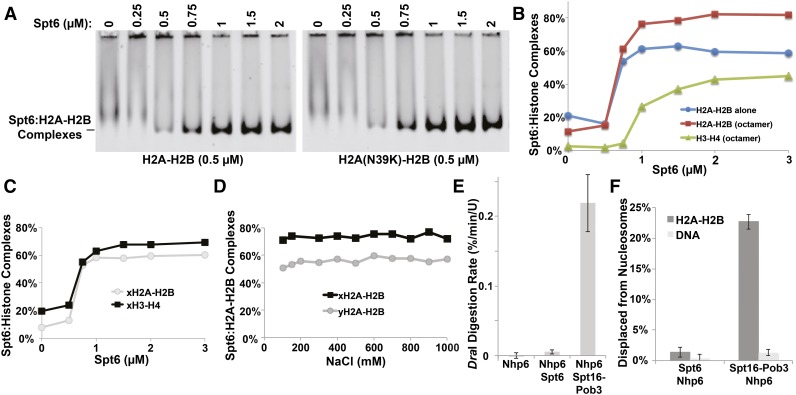
Biochemical analysis of Spt6 functions in vitro. (A) Various concentrations of purified Spt6 were mixed with 200 nM yeast H2A or H2A-N39K dimerized with fluorescently labeled H2B. Complexes were separated by native PAGE (EMSA) and detected with a STORM scanner (GE). (B) Complexes were detected as in A but using either H2A-H2B dimers alone or histones assembled into octamers in high salt and then diluted to reaction conditions shortly before use. Signals were plotted for each component as shown. (C) Complexes were detected by EMSA as in A but using labeled recombinant histones with sequences from X. laevis. (D) Spt6:H2A-H2B complexes were formed using either yeast or frog proteins and then titrated with NaCl and tested by EMSA. (E) Nucleosomes assembled with 5S rDNA and yeast histones was mixed with Nhp6, Spt6 + Nhp6, or Spt16 − Pob3 and Nhp6 (FACT), and then the rate of digestion of the unique DraI site near the center of the 5S rDNA nucleosome positioning sequence was determined as described by Xin et al. (2009). Measurements were made in triplicate, and the average and SD were plotted. (F) Nucleosomes assembled with 5S rDNA and yeast histones with a fluorescent label in the H2A-H2B dimer were incubated with Spt6 + Nhp6 or FACT; then an excess of unlabeled genomic DNA was added prior to electrophoretic separation on native acrylamide gels to disrupt binding to nucleosomes. The amount of H2A-H2B displaced from the nucleosomes was determined in triplicate, and the average and SD were plotted.

