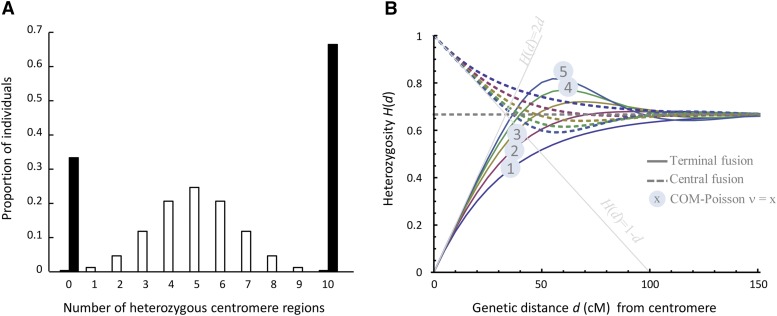
Figure 1.
Expected interchromosomal (A) and intrachromosomal patterns (B) of heterozygosity reduction in automictic offspring. (A) The proportion of individuals that retain parental heterozygosity at a given number (out of 10) centromeric regions. Solid bars represent automictic offspring, which should always have either 0 or 10 heterozygous centromeric regions (the relative proportion of individuals with heterozygous vs. homozygous regions depends on the proportion of offspring produced by central vs. terminal fusion; here 2/3 central fusion is assumed). The open bars represent self-fertilized controls. (B) Expected offspring heterozygosity as a function of the genetic distance from the centromere under central (dashed) and terminal (solid) fusion and different degrees of crossover interference (File S2). ν = 1 corresponds to no interference, and the two gray lines correspond to complete interference. The dashed gray line gives the expected heterozygosity for centromere–distal markers (2/3).

