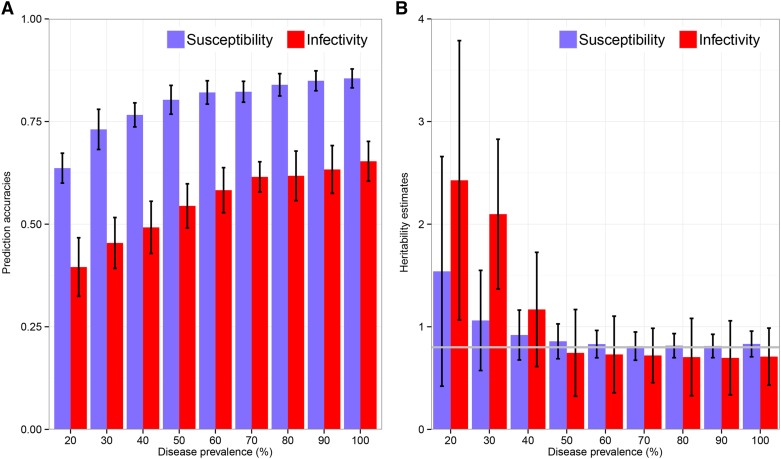
Figure 5.
Effect of disease prevalence on model estimates. (A and B) Mean prediction accuracies of paternal additive genetic effects (A) and posterior mean heritabilities (B) obtained when fitting the dnIGE model to simulated data sets, using group size 10, heritability 0.8, and population disease prevalence ranging from 0.2 to 1. Black lines in A and B represent plus or minus standard error of mean predictive accuracy and heritability, respectively, over 10 replicates. Gray line in B indicates true heritabilities.

