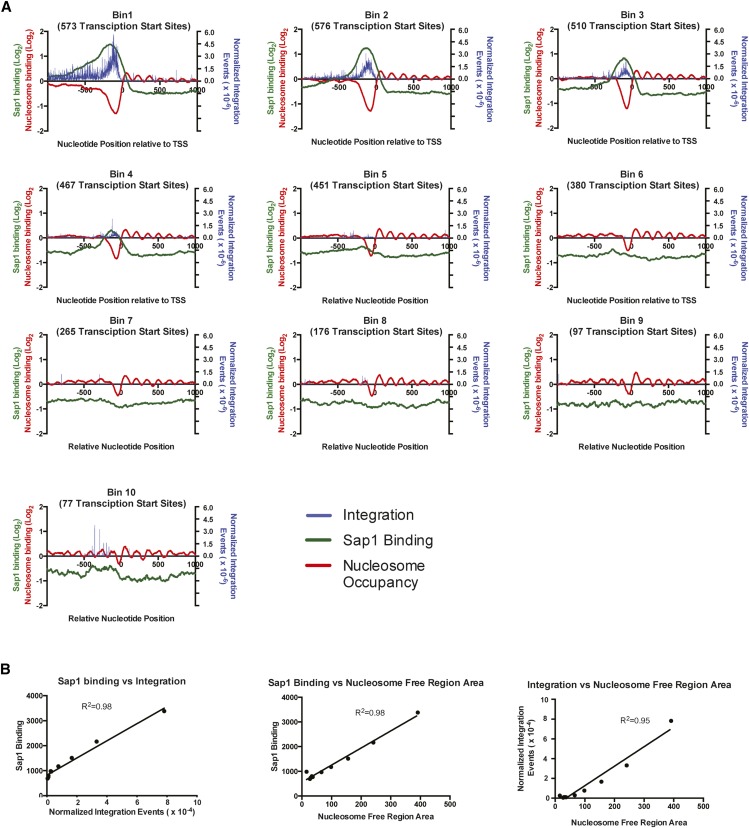
Figure 5.
Tf1-insertion and Sap1-binding regions both align with NFRs at TSSs. (A) Graphs showing the alignment of all TSSs within 10 bins of intergenic regions from the S. pombe genome. The bins are sorted based on the number of Tf1 insertions occurring within the intergenic regions and are arranged in descending order. For each bin, the average number of Tf1 insertions and average value of Sap1 enrichment (log2 ratio of Sap1 binding to WCE signal) and nucleosome occupancy are plotted on the y-axis at each nucleotide position within 1000 bp of the aligned TSSs. For these analyses, the number of Tf1 insertions was normalized by dividing the amount of integration of each position by the total number of Tf1 insertions. (B) Graphs showing the pairwise comparisons and linear regression analysis of the sum of Tf1 integration, Sap1 enrichment, and area of NFRs that occur 1000 bp upstream of all TSSs within each bin. For these analyses, Sap1 enrichment values were back-transformed into their original non-log2 number, and only the negative values of nucleosome occupancy data were used to sum the total area of NFRs.

