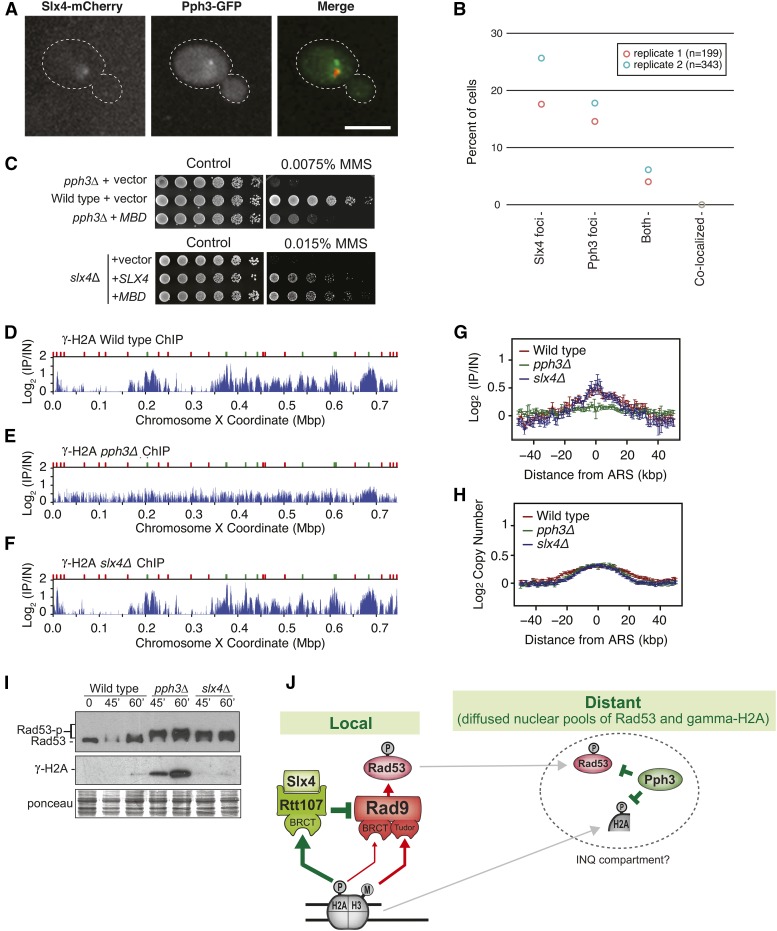
Figure 5.
Pph3 and Slx4 function in spatially distinct manners. (A) Representative images showing the intracellular localization of Slx4 and Pph3 proteins. (B) Slx4-yEmCherry and Php3-GFP foci were measured by confocal fluorescence microscopy after MMS treatment. The percentage of cells with Slx4-yEmCherry, Php3-GFP, and both Slx4-yEmCherry/Php3-GFP foci is plotted. (C) Serial dilution assay showing the effect of MBD expression on the MMS sensitivity of the selected strains. MBD and SLX4 were expressed from a pRS416 plasmid (for details see Table S2) in SC –URA. (D–F) ChIP-seq analysis was performed following synchronous release of wild-type (D), pph3Δ (E), and slx4Δ (F) cells into S phase in the presence of 0.04% MMS for 60 min. γ-H2A (S129) enrichment scores on chromosome X are shown. Early origins are indicated by green bars and late origins by red bars. (G and H) The median γ-H2A ChIP enrichment scores (G) and replication profiles (H) across 108 early-firing origins, in wild-type, pph3Δ, and slx4Δ cells, are plotted. (I) Immunoblot showing the status of Rad53 and γ-H2A in wild-type, pph3Δ, and slx4Δ cells after treatment of G1 synchronized cultures with α-factor and release into medium containing 0.01% MMS for the indicated time points. (J) Proposed model illustrating how Pph3 and Slx4 coordinate Rad53 downregulation in spatially distinct manners.

