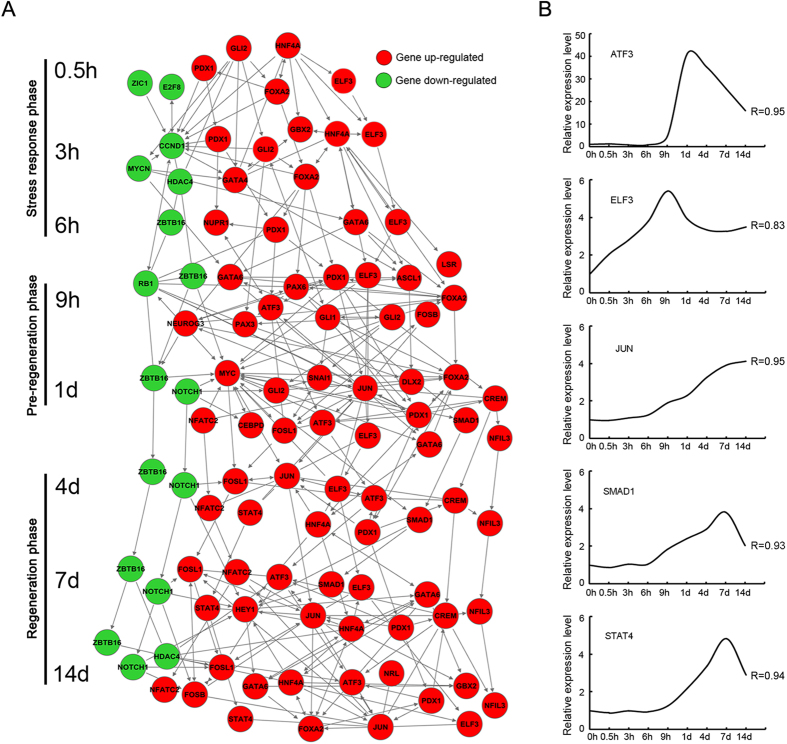
Figure 6. Cascade regulation of transcription factors.
(A) Networks showing the connections and interactions between up-regulated (red) and down-regulated (green) transcription factors. (B) RT-qPCR validation of microarray analysis for the differential expression of several key transcription factors. R stands for the correlation coefficient between microarray and RT-qPCR data.

