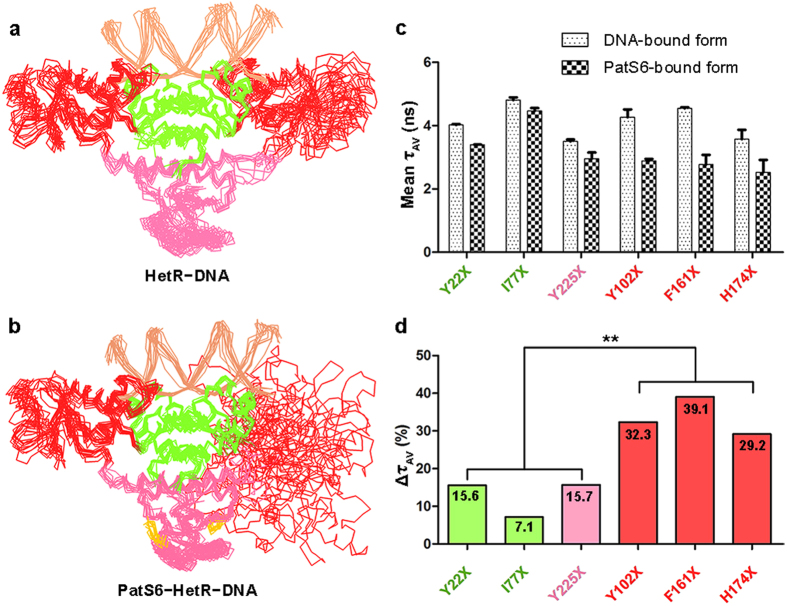
Figure 4. Putative conformational changes of HetR upon PatS6 binding.
Computational simulation of (a) HetR−DNA and (b) PatS6−HetR−DNA. The structure ensembles, including DNA (light orange) and PatS6 (yellow), are presented as ribbon. (c) Fluorescence lifetime spectroscopy assays of six HetR mutants. The amplitude-averaged lifetimes (τAV) of six HetR mutants with standard error are shown as histograms. (d) The relative changes of τAV in percentage. The data are analyzed using an independent samples t-test (**stands for p < 0.01).

