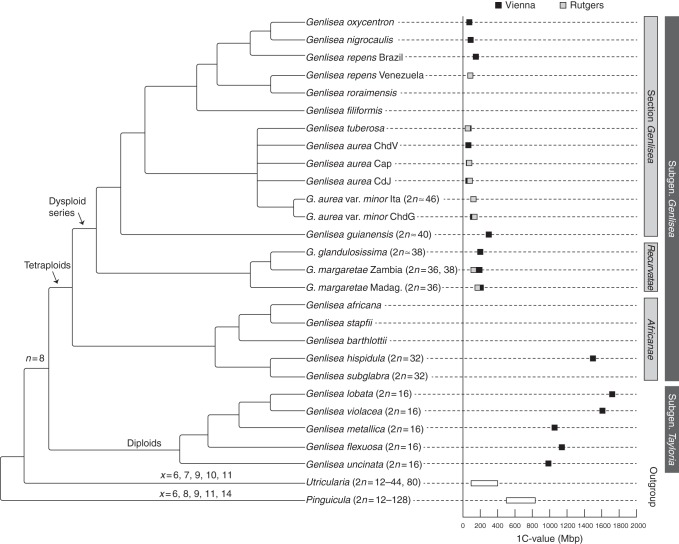
Fig. 4.
Genome size variation and karyotype evolution in Genlisea. DNA 1C values of studied species and a phylogenetic tree based on molecular sequence data of three chloroplast loci (Fleischmann et al., 2010); the phylogenetic position of G. tuberosa is based on unpublished rps16 and trnQ-rps16 sequence data (deposited at GenBank, accession numbers KF952604 and KF952605); only tree branches that had maximal statistic support (bootstrap value >90, Bayesian posterior probability = 1) are shown as resolved; chromosome base numbers and suggested ploidy levels are shown on the respective branches of monophyletic groups. The range of 1C DNA content and chromosome numbers for the Lentibulariaceae outgroup taxa Pinguicula and Utricularia are taken from Greilhuber et al. (2006) and from Casper and Manitz (1975), Rahman et al. (2001) and Casper and Stimper (2009), respectively, 1C values for Genlisea uncinata are from Greilhuber et al. (2006) and those for G. nigrocaulis are from Vu et al. (2012).

