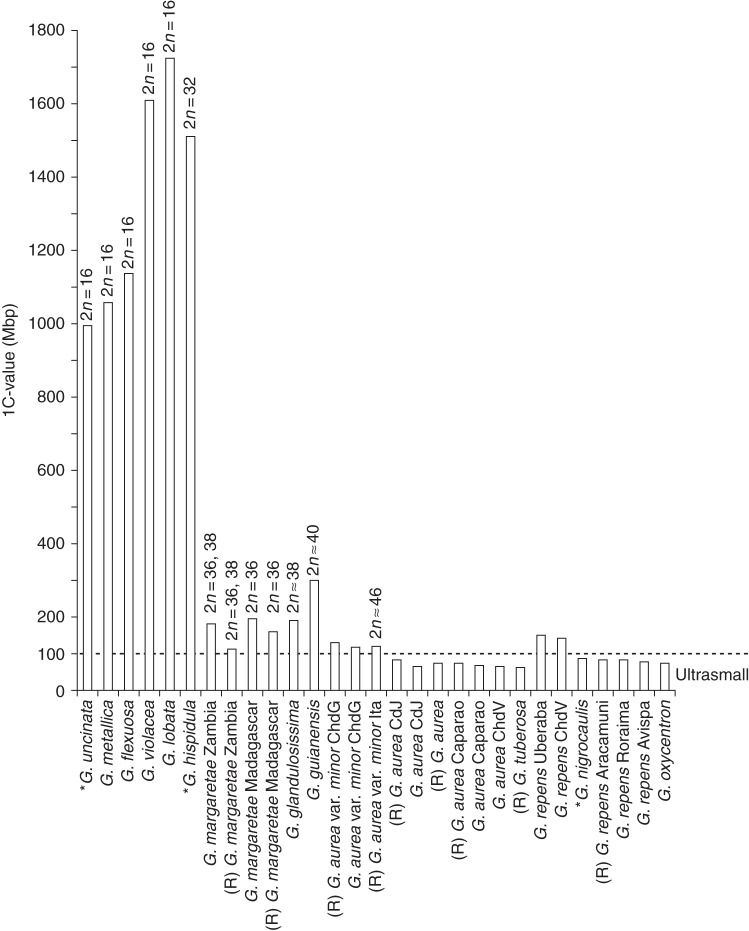
Fig. 5.
Evolutionary decrease in genome size in Genlisea. The species are arranged in phylogenetic order on the x-axis, from basal branching (left) to derived taxa (right; following Fleischmann et al. 2010); their average 1C values are shown on the y-axis. The 1C values obtained as size estimates from flow cytometry measurements at Rutgers are marked ‘(R)’. The respective 2n number is indicated where known. Genome sizes of taxa marked with an asterisk are taken from the literature (Greilhuber et al., 2006; Vu et al., 2012). For abbreviations of location data, see vouchers in Table 1.

