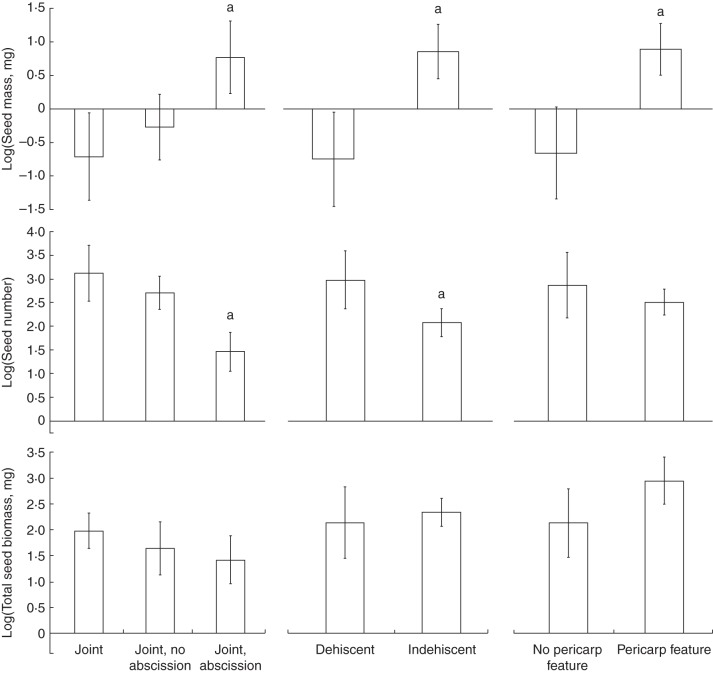
Fig. 2.
Evolution of fruit and seed traits. Associations were tested for using phylogenetic generalized linear models (PGLMs; Supplementary Data Table S10). Bar graphs are provided of phylogenetically corrected mean estimates of seed traits (y-axis) for each fruit trait state (x-axis). Error bars indicate the standard error (s.e.). Significant differences are indicated with a letter (a, different from first state; b, different from second state). Significance was adjusted for multiple comparisons (three seed traits) using Bonferonni correction (α0·05 = 0·0167). Mean and s.e. estimates represent the median values from each analysis run across 100 trees sampled from the Bayesian posterior distribution.

