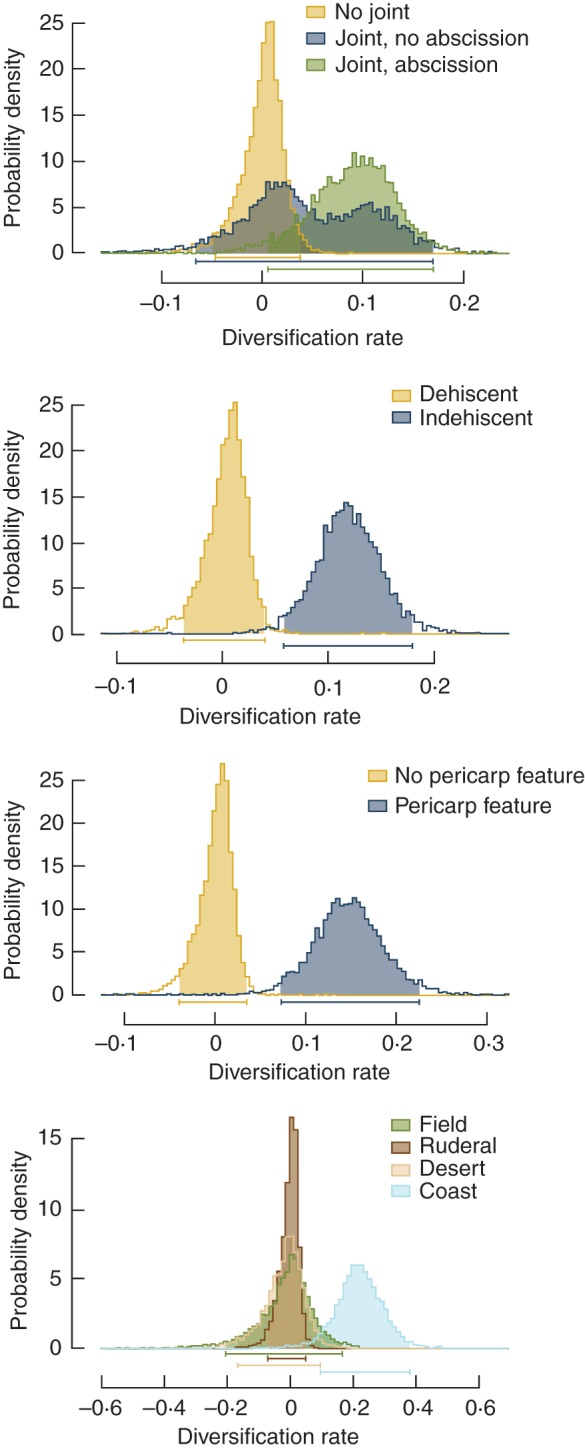
Fig. 4.

Diversification rates of taxa with different fruit traits (see keys in graphs) and habitat. Diversification rates were calculated as the difference between speciation and extinction rates. These rate estimates are from diversification analysis on the Bayesian consensus tree as an illustration of the patterns found in a more thorough analysis accounting for unsampled taxa and phylogenetic uncertainty (see Supplementary Data Table S15 for estimated speciation and extinction rates separately).
