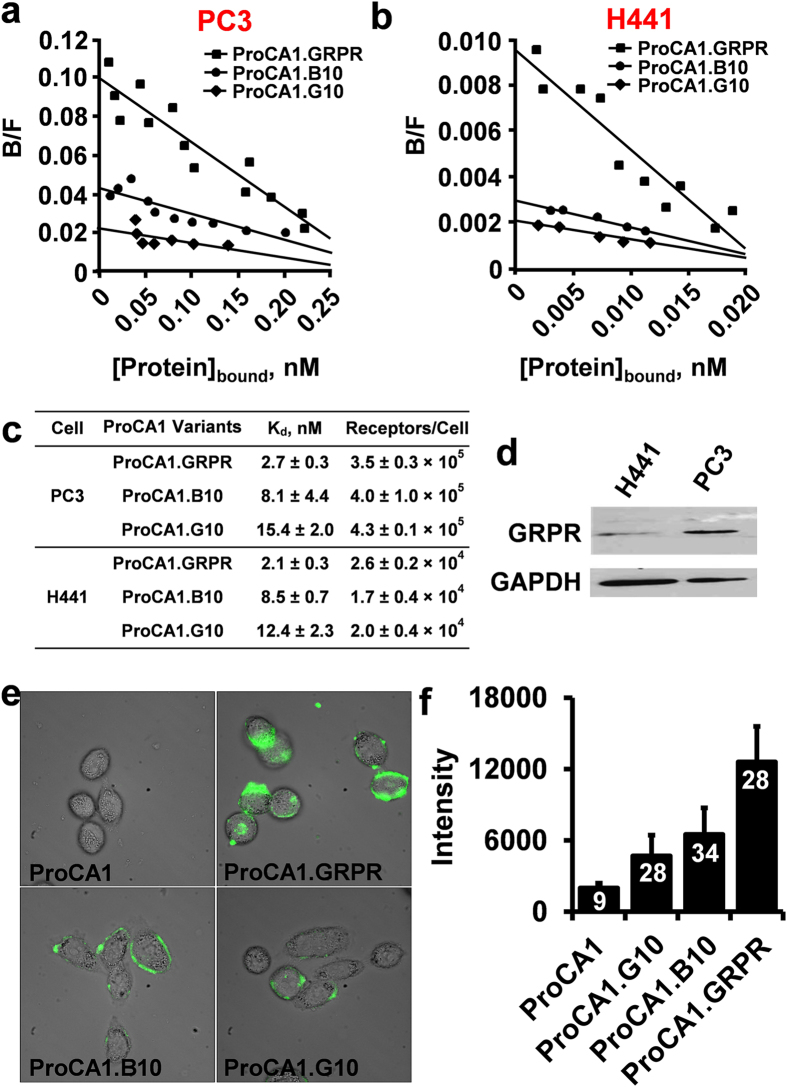
Figure 3. Characterization of the interaction between ProCA1.GRPR and GRPR on tumor cells.
(a, b) Determination of the binding affinity of ProCA1 variants to GRPR in PC3 (a) and H441 cells (b) by Scatchard plot. (c) Summary of GRPR binding affinity of ProCA1 variants in PC3 and H441 cells. ProCA1.GRPR exhibits the highest GRPR binding affinity among the three designed protein MRI contrast agents in both PC3 and H441 cells. The GRPR numbers (Bmax) per PC3 cell were 13–23 times higher than those of H441. (d) Western blot shows that GRPR has a higher level of expression in PC3 cells than that of H441 cells. The images a,b,d are representatives of three independent experiments. (e) Fluorescence imaging of PC3 cells incubated with fluorescein-labeled ProCA1 variants (green). (f) Fluorescence intensity of PC3 cells incubated with different ProCA1 variants. The mean and standard derivation (error bar) of fluorescence intensity were quantified from 9, 28, 34 and 28 cells after incubation with ProCA1, ProCA1.G10, ProCA1.B10, and ProCA1.GRPR, respectively. Data are expressed as mean ± s.d.

