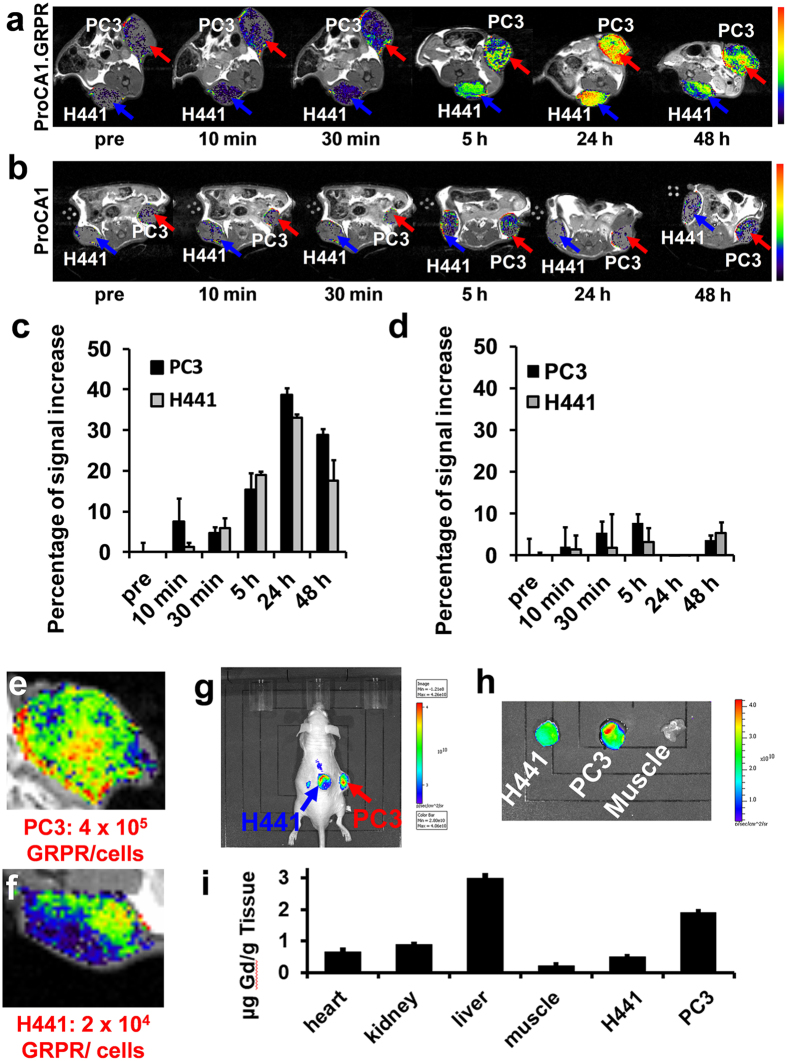
Figure 4. Molecular imaging of the GRPR biomarker on mice xenografted with PC3 and H441 cells by T1-weighted spin echo MR imaging and NIR imaging.
(a) T1-weighted spin echo MR imaging of ProCA1.GRPR targeting GRPR in PC3 (red arrow) and H441 (blue arrow) xenografted mice tumors. (b) T1-weighted spin echo MR imaging of non-targeted ProCA1 in PC3 (red arrow) and H441 (blue arrow) xenografted mice tumors. (c) Percentage of increase in MRI signal in PC3 and H441 tumor before and after injection of ProCA1.GRPR. PC3 tumor exhibits a 1.5 fold higher MRI enhancement compared with H441 tumor at 48 hours post injection of ProCA1.GRPR. (d) Percentage of MRI signal increase in PC3 and H441 tumor before and after injection of non-targeted ProCA1. As a negative control, non-targeted ProCA1 does not have significant enhancement in both tumors after injection of non-targeted ProCA1. Images a-d are representatives of three independent experiments. Data are expressed as mean ± s.d. of percentage increase of tumor intensity values measured from different MRI slides of H441 or PC3 tumor in each representative animal from three independent experiments. (e, f) MRI shows heterogeneous enhancement in PC3 (e) and H441 tumors (f) after injection of ProCA1.GRPR. (g) NIR imaging of PC3 and H441 xenografted mice tumors 48 hours post ProCA1.GRPR injection. (h) NIR imaging of isolated PC3, H441 tumors and muscle 48 h post injection of ProCA1.GRPR. PC3 tumor shows higher NIR intensity compared to H441 tumor. (i) Gd3+ distribution in different tissues 48 hours post ProCA1.GRPR injection. Data are expressed as mean ± s.d.

