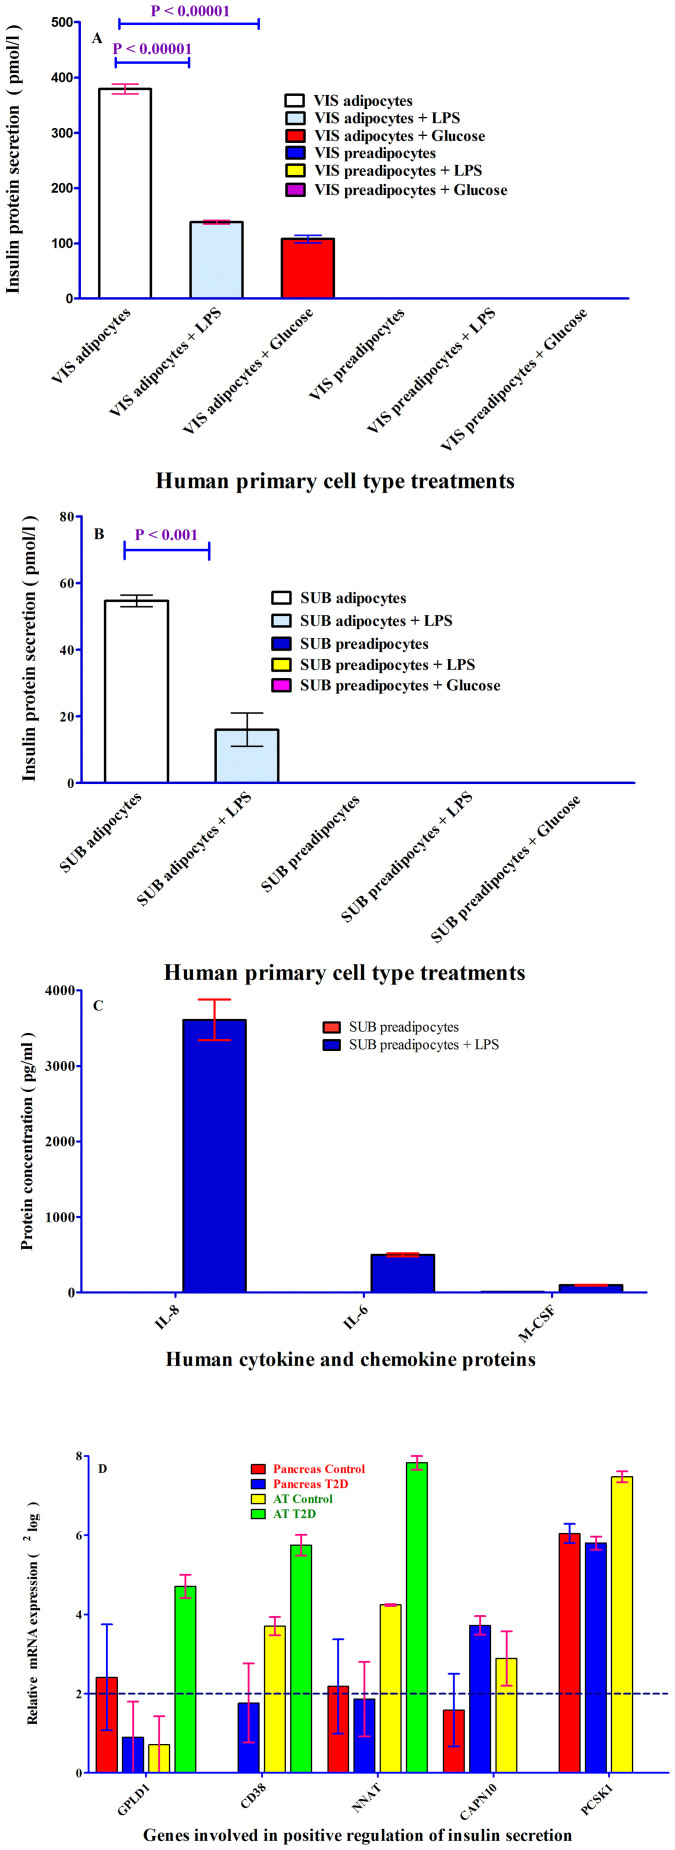
Figure 5.
(A–B). ELISA Analysis of insulin in secreted fraction collected from human primary preadipocytes and adipocytes. ELISA analysis of secreted fractions collected from with and without lipopolysaccharides (LPS (200 ng/ml)) and 25 mM glucose treated human primary visceral and subcutaneous preadipocytes and adipocytes. DAKO insulin ELISA kit was applied to measure insulin concentrations in the secreted fractions. Two independent ELISA was used to measure insulin concentrations in secreted fractions; insulin concentration in secreted samples was performed respectively in single and duplicate by ELISA. Insulin concentrations were expressed in pg/ml as shown in Y-axis. (panel A); visceral cells and (Panel B). subcutaneous cells. The p-value obtained from an independent two-tailed test samples (T-Test). P < 0.05 was accepted as statistically significant. (Panel C). IL-6, IL-8 and M-CSF analysis in human primary subcutaneous preadipocytes. IL-6, IL-8 and M-CSF were measured in human primary subcutaneous preadipocytes, using Bio-plex according to instructions provided by Bio-Legend. Red bars represent human preadipocytes without LPS treatment and dark blue bars show human preadipocytes treated with LPS. The concentrations of these three cytokine and chemokines were expressed as pg/ml shown in Y-axis. Samples were measured in duplicate. (Panel D). mRNA analysis of genes involved in positive regulation of insulin secretion, glucose induced insulin stimulation in pancreas, and biosynthesis of insulin. GPLD1, CD38, NNAT, CAPN10 and PCSK1 genes were measured in human pancreas and AT with and without T2D. The first four genes are involved in positive regulation of insulin secretion and PCSK1 is involved in biosynthesis of insulin via proinsulin conversion. Glucagon (GCG) was depicted in Figure 2 C. mRNA expression expressed as2log. Each sample was measured two or three times by mRNA expression assay for pancreas and AT respectively.

