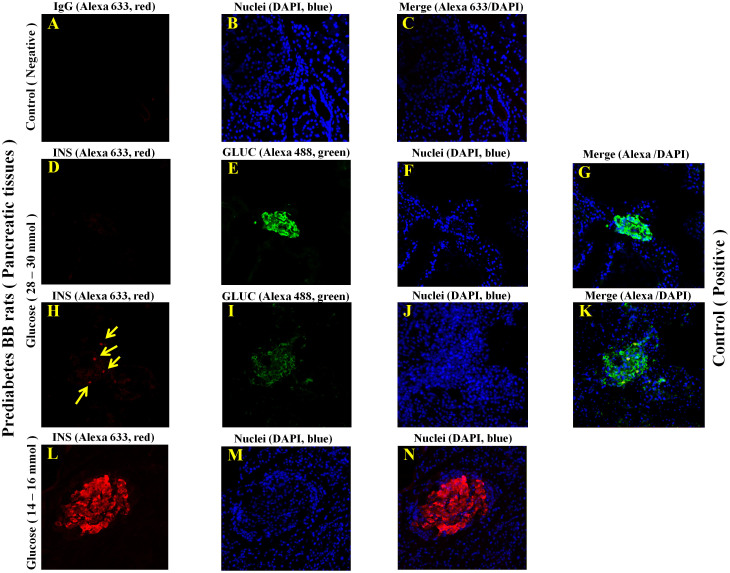
Figure 7.
(A–N). The localization and visualization of Insulin and Glucagon in the pancreas tissue cryostats of prediabetes BB rats (T1D-like model) using confocal microscopy strategy. Confocal microscopy analysis was used to localize Insulin and Glucagon in insulin dependent diabetes mellitus (IDDM) and control rats. The glucose concentration of control rats were between 14 and 16 mmol/l. The glucose concentration in IDDM rats were between 28–30 mmol/l. Cryostats were made from pancreas tissues of these rats. The thickness of pancreas cryostats was 5 µm. A cryostat slide was stained only with IgG isotype and alexa 633 coupled goat anti-guinea pig (panel A); considered as a negative control). This slide was not incubated with primary polyclonal antibody. The nuclei were stained with DAPI. Other cryostats were also stained with Polyclonal antibody against rat insulin and bound antibodies were displayed with alexa 633 coupled goat anti-guinea pig (panel D and G; H and K; L and N; red color). Other cryostats were also stained with Polyclonal antibody against rat glucagon and bound antibodies were displayed with alexa 488 coupled goat anti-rabbit (panel E and G; I and K; green color). DAPI was used to stain and detect nuclei in all tissues; F and G; J and L; N and O; dark blue color. Fluorescent labeling was used for all detections. Insulin was not detected in IDDM rats but glucagon (green fluorescent) well. Insulin was found to be positive in islets of Langerhans-associated β cells in control rats. In an islet of Langerhans, four β cells were found to be positive for insulin as indicated by 4 light yellow arrows. Glucagon as positive control was found to be positive in the pancreas-associated islets of Langerhans β cells in both IDDM and control rats.

