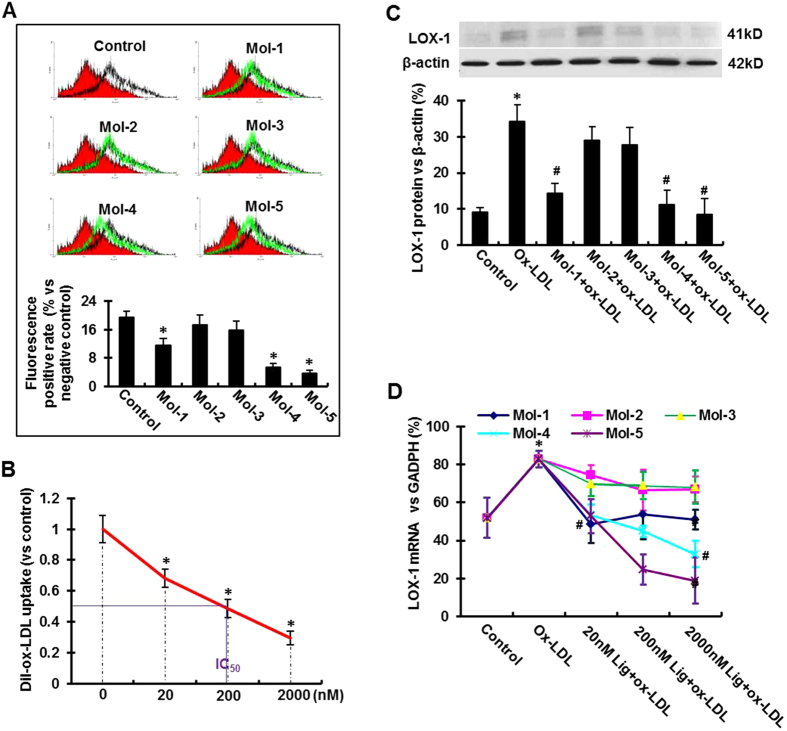
Figure 3. Inhibitory effect of the lead compounds on Dil-ox-LDL uptake by HUVECs and CHO cells (measured by flow cytometry) and the effect of the lead compounds on ox-LDL-induced LOX-1 mRNA and protein expression.
(A) (Upper Panel) Flow cytometry measurements using HUVECs in the presence of the five lead compounds (Mol-1–Mol-5), each a at 200 nM concentration. (Lower Panel) The percentage of internalized ox-LDL. Graphs show data as mean (±SD); n = 4. *P < 0.01 or < 0.05 vs. control. (B) IC50 value for Mol-5. IC50 value (in nM) is based on inhibition of Dil-ox-LDL uptake in CHO cells overexpressing human LOX-1. Graphs show data as mean (±SD); n = 5. *P < 0.01 or < 0.05 vs. control. (C) Western blotting assay showing LOX-1 protein expression in HUVECs following incubation with 200 nM Mol-1 to Mol-5 for 30 min, and subsequently exposure to 5 μg/mL ox-LDL for 6 hours. (D) The variation of LOX-1 mRNA expression levels at different concentrations of the compounds following exposure of HUVECs to 5 μg/mL ox-LDL. The concentrations are indicated on the X-axis and the LOX-1 mRNA levels are shown on the Y-axis. The plots for all the five molecules are shown in separate colors. Graphs show data as mean (±SD); n = 3. *P < 0.01 vs. control; #P < 0.01 vs. ox-LDL group.

