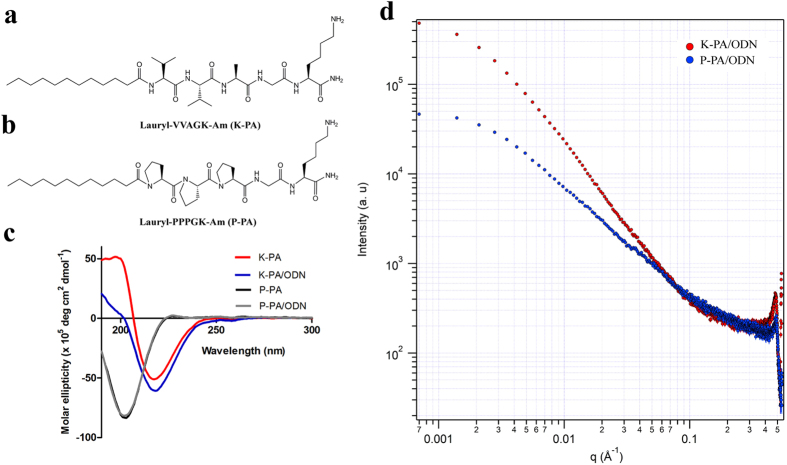
Figure 2. Structural characterizations of PA/ODN nanostructures.
Chemical representations of (a) K-PA (Lauryl-VVAGK-Am) and (b) P-PA (Lauryl-PPPGK-Am). (c) CD spectra of PAs and PA/ODN complexes. (d) SAXS profiles of K-PA/ODN and P-PA/ODN complexes; y axis of the plot indicates scattering intensity, while x axis indicates scattering vectors.

