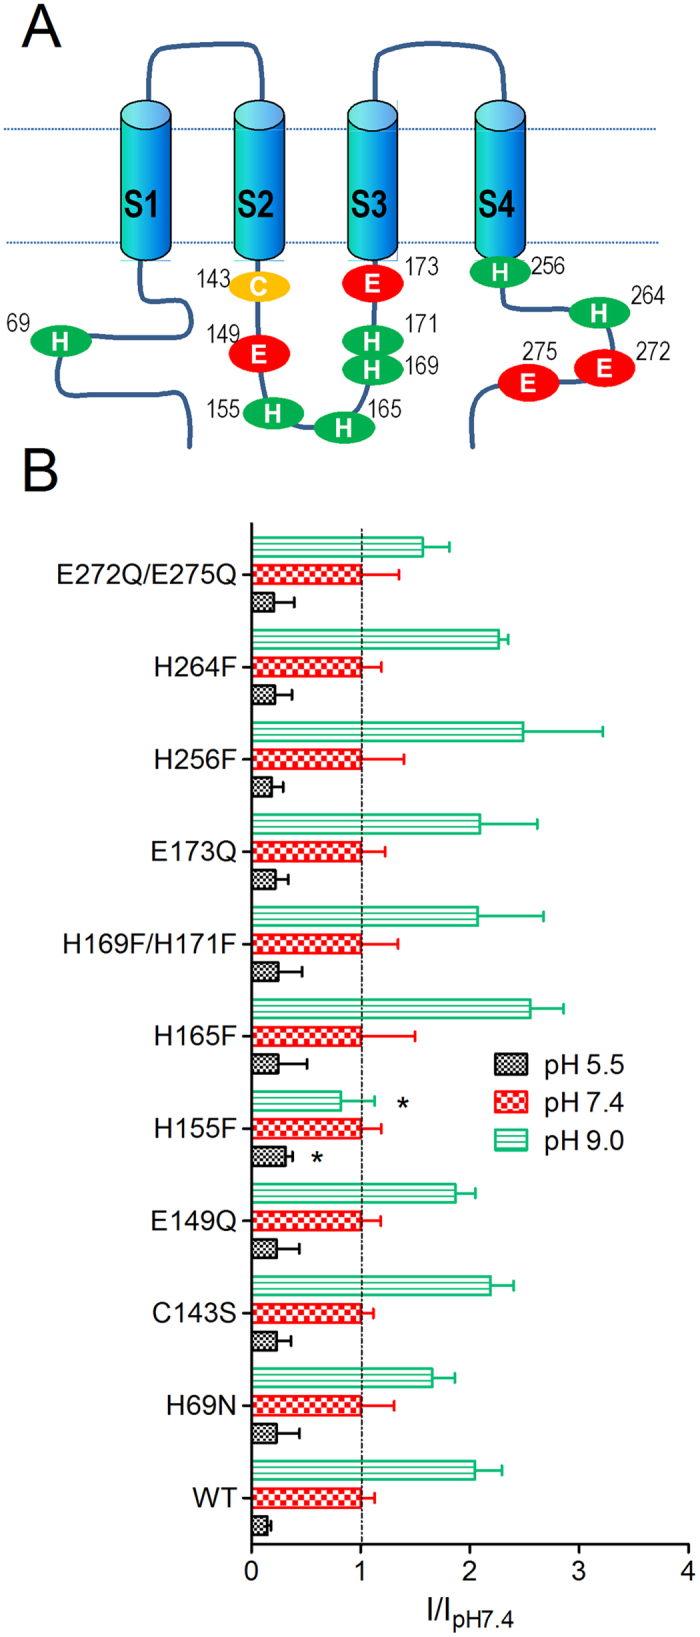
Figure 6. Effects of neutralization of internal residues on pHi sensitivity of Orai1/STIM1.

(A) Schematic diagram of Orai1 showing the position of the substituted residues. There were 8 single mutants and two double mutants. (B) Averaged changes of current amplitude by pHi 5.5 and 9.0 in the mutants in comparison with the WT Orai1/STIM1. Current amplitude at pHi 5.5 and 9.0 was normalized to that at pHi 7.4. Data were analyzed by ANOVA followed by t-test with Bonferroni correction.
