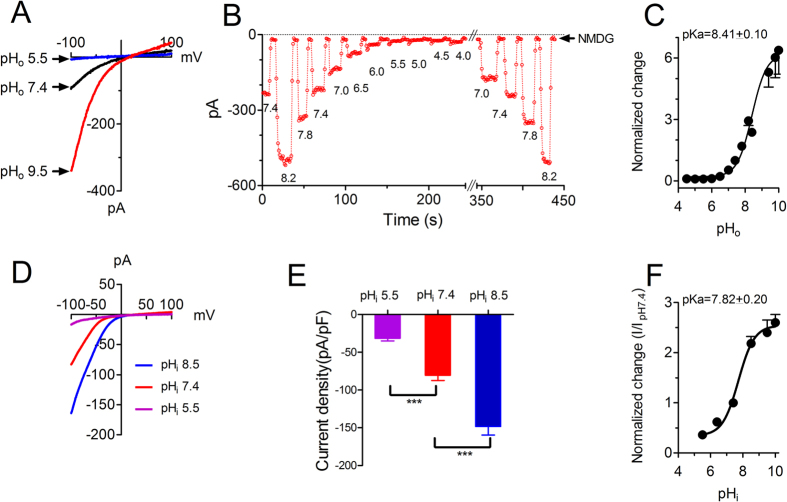
Figure 8. Effects of pHo and pHi on endogenous ICRAC currents in RBL cells.
(A) Representative recording of ICRAC in RBL cells. Currents were elicited by a ramp protocol ranging from −100 to +100 mV in DVF solutions. After ICRAC activation reached a steady-state, the cell was exposed to external solutions with different pH. (B) Concentration-dependent effects of pHo on ICRAC. NMDG was used to test leak current. The inhibition and potentiation effects of pHo were reversible. (C) Dose-response curve constructed using current normalized to the current amplitude at pHo 7.4. The best fit of the dose-response curve yielded pKa of 8.41 ± 0.10 (Mean ± SEM, n = 8–11). (D) Representative traces of ICRAC at pHi 5.5, 7.4, and 8.5. (E) Average current amplitude of ICRAC at pHi 5.5, 7.4 and 8.5. (F) Dose-response curve constructed using current normalized to the current amplitude at pHi 7.4. The best fit of the dose-response curve yielded pKa of 7.82 ± 0.2 (Mean ± SEM, n = 7–13).

