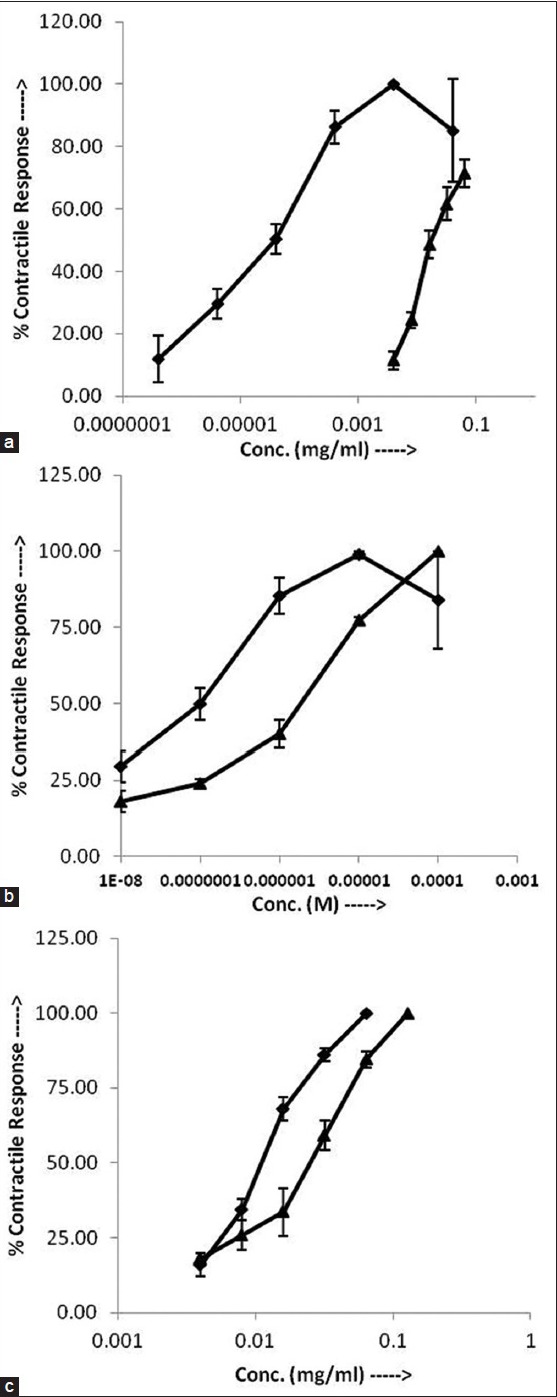
Fig. 2.

Serotonergic effects of PG.
Cumulative log concentration-response curves of (a) 5-HT ( ) and PG (
 ) (b) 5-HT (
 ) and 5-HT+ketanserin (10-6 M) (
 ) (c) PG (
 ) and PG+ketanserin (10-6 M) (
 ) on isolated rat fundus. Values are expressed as mean±SEM (n=3).
