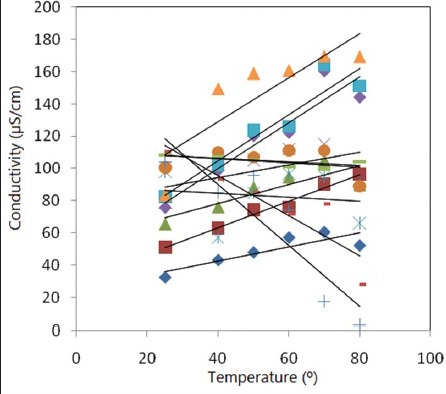
Fig. 2.

A relation between temperatures versus conductivities for emulsions with different concentrations of the ESB.
A relation between temperatures versus conductivities up to 80° for all the tested O/W emulsions with different concentrations of the ESB starting from 3% up to 19%. R2 value for each relation was recorded. Co. stands for concentration of the ESB (the figure determines the ESBC of the simple formulae of paraffin-in-water emulsions stabilized by sorbitan derivatives). 3% Co ( ) R2=0.743; 5%Co (
 ) R2=0.981; 7% Co (
 ) R2=0.711; 9% Co (
 ) R2=0.341; 11% Co (
 ) R2=0.019; 13% Co (
 ) R2=0.068; 15% Co (
 ) R2=0.811; 17% Co (
 ) R2=0.813; 19% Co (
 ) R2=0.600; 9.5% Co (
 ) R2=0.879; 10% Co (
 ) R2=0.894; 10.5% Co (
 ) R2=0.713.
