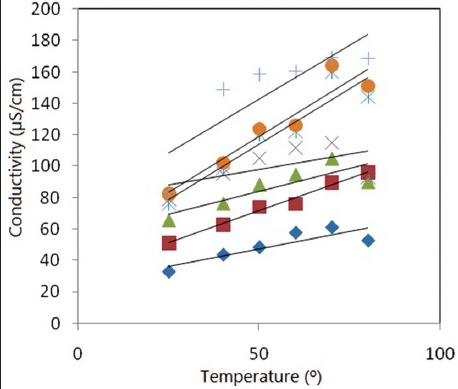
Fig. 3.

A relation between the temperatures versus conductivities with no gel consistency and concentrations of the ESB.
A relation between the temperatures versus conductivities up to 80° for each O/W emulsion with no gel consistency and with concentrations of the ESB starting from 3% up to 10.5%. The least squares regression line equation for each relation was recorded. Co. stands for concentration of the ESB. 3% Co ( ) y=0.440x+25.34, R2=0.743; 5% Co (
 ) y=0.824x+30.47, R2=0.981; 7% Co (
 ) y=0.584x+54.93, R2=0.711; 9% Co (
 ) y=0.393x+78.49, R2=0.341;9.5% Co (
 ) y=1.411x+43.76, R2=0.879; 10% Co (
 ) y=1.426x+47.70, R2=0.894; 10.5% Co (
 ) y=1.371x+74.09, R2=0.713.
