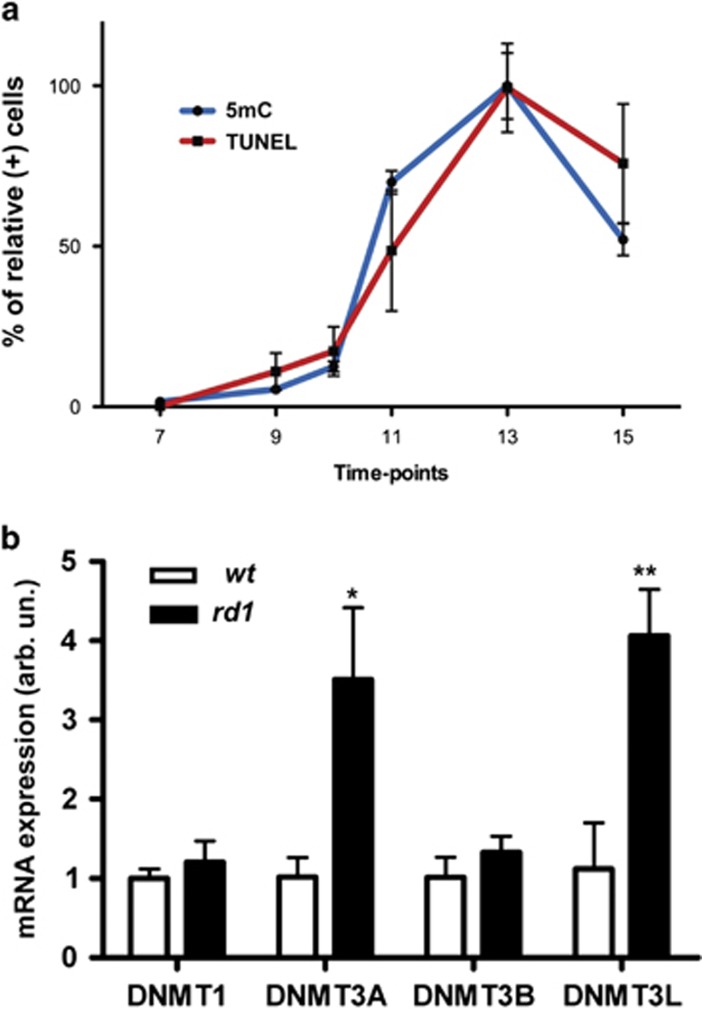
Figure 4.
Temporal dynamics of DNA methylation and DNMT gene expression. (a) In rd1 ONL, at early PN ages, the numbers of photoreceptors showing 5mC staining were very low, increased from PN11 onwards, and peaked at PN13. The temporal progression of 5mC positivity in rd1 ONL corresponded largely to the extent of cell death as evidenced by TUNEL staining, implying a close connection between DNA methylation and cell death. (b) Quantitative reverse transcriptase–PCR analysis of different DNMT mRNAs showed a statistically significant upregulation of DNMT3A and DNMT3L expression in rd1 retina. Data points in panel (a) represent the percentage of relative positive cells (peak value=100%)±S.D., with n=3–4. Bars in panel (b) represent mean±S.D., n=3, with arbitrary units (arb. un.) for mRNA expression (wt=1). Values were compared using the Student's t-test. *P<0.05, **P<0.01

