Figure 5.
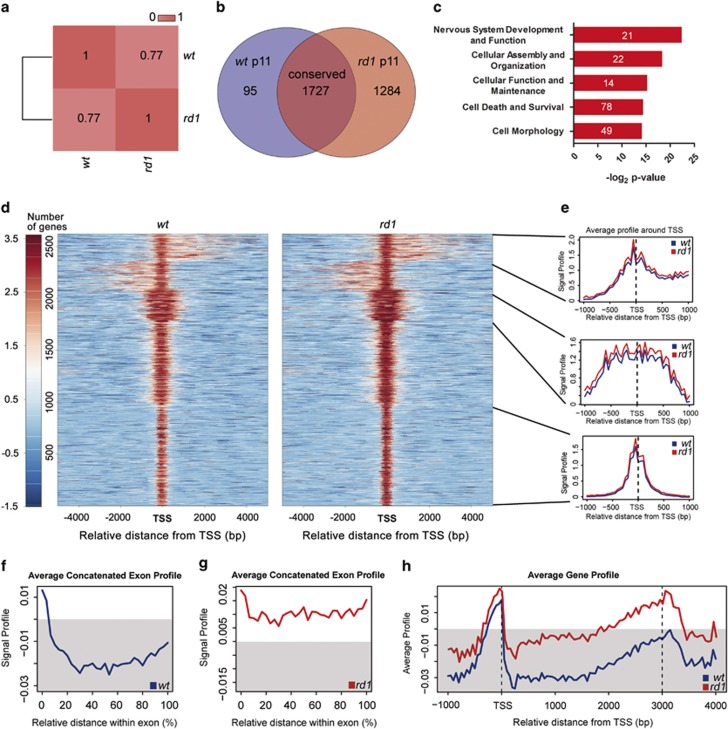
Genomic distribution of 5mC in rd1 and wt mice at PN11. (a) Correlation plot of methylation distribution between wt and rd1 retinae at PN11. Venn diagram of differentially methylated genes in wt (violet) and rd1 (red), showing 1284 genes to be hypermethylated in rd1, whereas only 95 genes are hypomethylated. (b) Additionally, 1727 genes have conserved methylation patterns. (c) Gene ontology analysis of genes methylated in rd1 retina. (d) Heatmap representations of 5mC enrichment in identified peak regions (5 kb flanking the transcription start site (TSS), which is the 5′ position of a gene sequence, where transcription starts). (e) Exemplified composite profiles for different clusters. Composite signal profiles of 5mC patterns in genes characterized by 5mC enrichment or lack of 5mC enrichment in concatenated exons in (f) the wt and (g) the rd1 retina. The methylation profiles for wt and rd1 reveal stronger methylation of exons in rd1, independent of the relative distance within the exon (f and g). (h) Overlayed average gene methylation profiles in wt and rd1 retina. Note the 5mC enrichment at gene promoter regions (500 bp upstream, i.e., left of TSS) for both genotypes, and in gene body towards 3′ end of the gene in rd1 (approximately 2000–3500 downstream, i.e., right of TSS) (h). Grey areas in (f–h) indicate regions without 5mC enrichment

