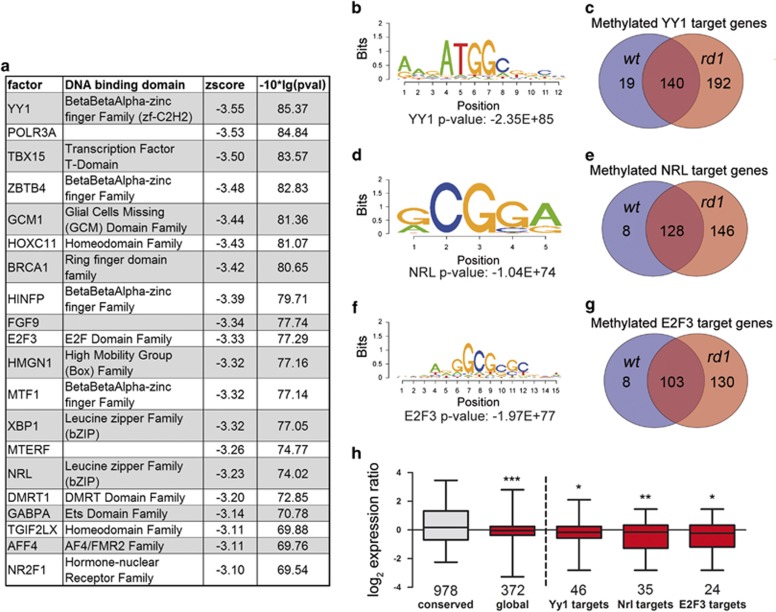
Figure 6.
Motif enrichment of methylation patterns and gene expression correlation. (a) The list shows the top 20 of motifs enriched in rd1 retina at PN11. Globally enriched motifs in methylated regions in rd1 retina at PN11 for (b) YY1, (d) NRL, and (f) E2F3. Venn diagrams of methylated genes containing binding motifs for (c) YY1, (e) NRL, and (g) E2F3 in wt and rd1. (h) Gene expression profile of methylation unaltered (conserved) genes and hypermethylated genes in rd1. Bars represent mean±S.E.M., n=3, of log2 (gene) expression ratios. Pairs of groups were compared using the Student's t-test. *P<0.05, **P<0.01, ***P<0.005

