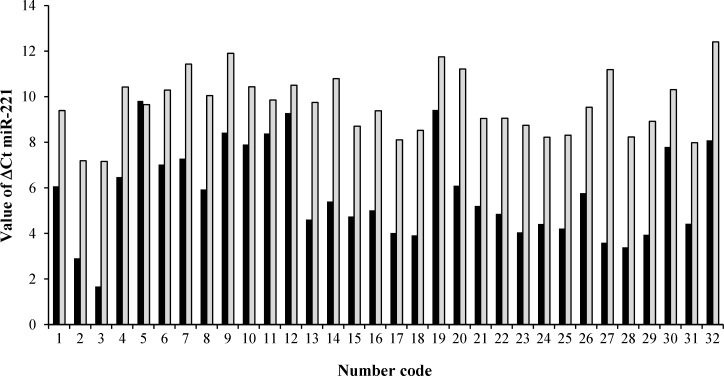
Fig. 3.
Ct values of miR-221 in human gastric tumor tissue and adjacent non-tumor tissue. The ΔCt range was from 1.67 to 9.81 in cancerous tissues, while it was from 7.16 to 12.40 in non-tumor tissues. Black and gray bars represent the expression level of miR-221 in patients and controls, respectively. Number code represents the number of patients

