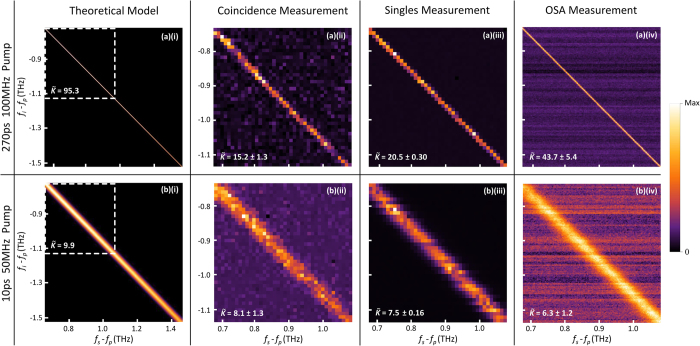
Figure 3.
The theoretically-calculated model and results of the six JSI measurements, for (a) the 270 ps and (b) 10 ps pump laser pulses: (i) scaled theoretical ideal model with dashed box representing the measured region, (ii) photon pair coincidence measurement, (iii) stimulated FWM singles-based measurement and (iv) stimulated FWM OSA measurement. The brightest pixel in each plot (Max of the colour bar) corresponds to: (a)(ii) 105 coincidences, (b)(ii) 105 coincidences, (a)(iii) 318,720 counts, (b)(iii) 182,210 counts, (a)(iv) 1716.7 nW/10 GHz, and (b)(iv) 464.1 nW/10 GHz. These maxima all have Poissonian error except those for (a)(iv) and (b)(iv) which have an inherent error from the OSA. SNLBs are shown for each plot with errors calculated from Monte Carlo simulations.

