Figure 1.

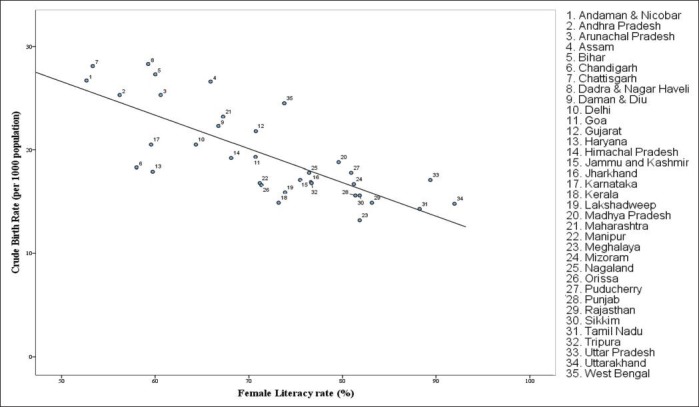
Scatter plot and linear regression of female literacy rates vs crude birth rates of states and union territories (UTs) of India (slope = – 0.325, P < 0.001, R2 = 0.590)

Scatter plot and linear regression of female literacy rates vs crude birth rates of states and union territories (UTs) of India (slope = – 0.325, P < 0.001, R2 = 0.590)