Figure 2.

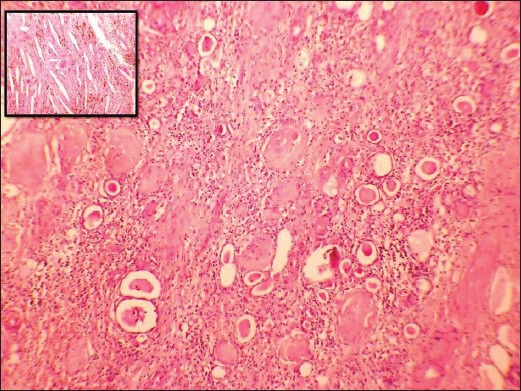
Atrophic and dilated renal tubules showing thyroidisation, sclerosed glomeruli and fibrosis. Inset show giant cells and cholesterol clefts (H and E, ×400)

Atrophic and dilated renal tubules showing thyroidisation, sclerosed glomeruli and fibrosis. Inset show giant cells and cholesterol clefts (H and E, ×400)