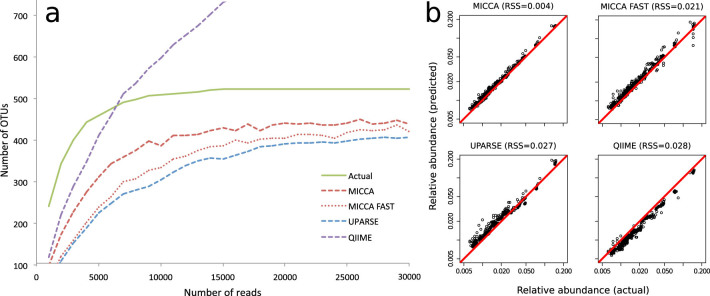
Figure 1. 16S-R dataset: Evaluation of MICCA pipeline performance compared with UPARSE and QIIME.
MICCA was also tested in fast variant (MICCA-FAST). In (a) the rarefaction curves are plotted. The continuous green lines represent the actual values. In (b) the relative abundances of the top 20 ranked OTUs compared to the actual values. RSS: Residual Sum of Squares.

