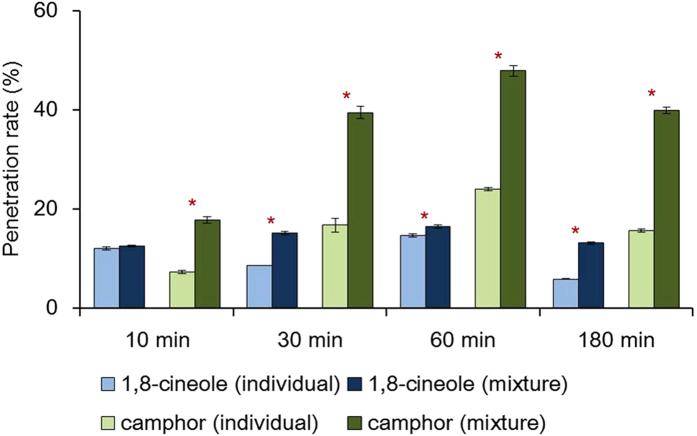
Figure 2. Penetration rate of the compounds when applied individually or when mixed in 3rd instar larvae of Trichoplusia ni.
Error bars indicate standard deviations (n = 3), and asterisks indicate statistical differences between individual and mixed applications within each time of observation (P < 0.05). Both compounds showed increased penetration rates when they were mixed (P < 0.05, except 1,8-cineole at 10 min), but the increase rate for camphor (15.9 to 36.2%, on average) was much greater than that for 1,8-cineole (10.3 to 14.3%).

