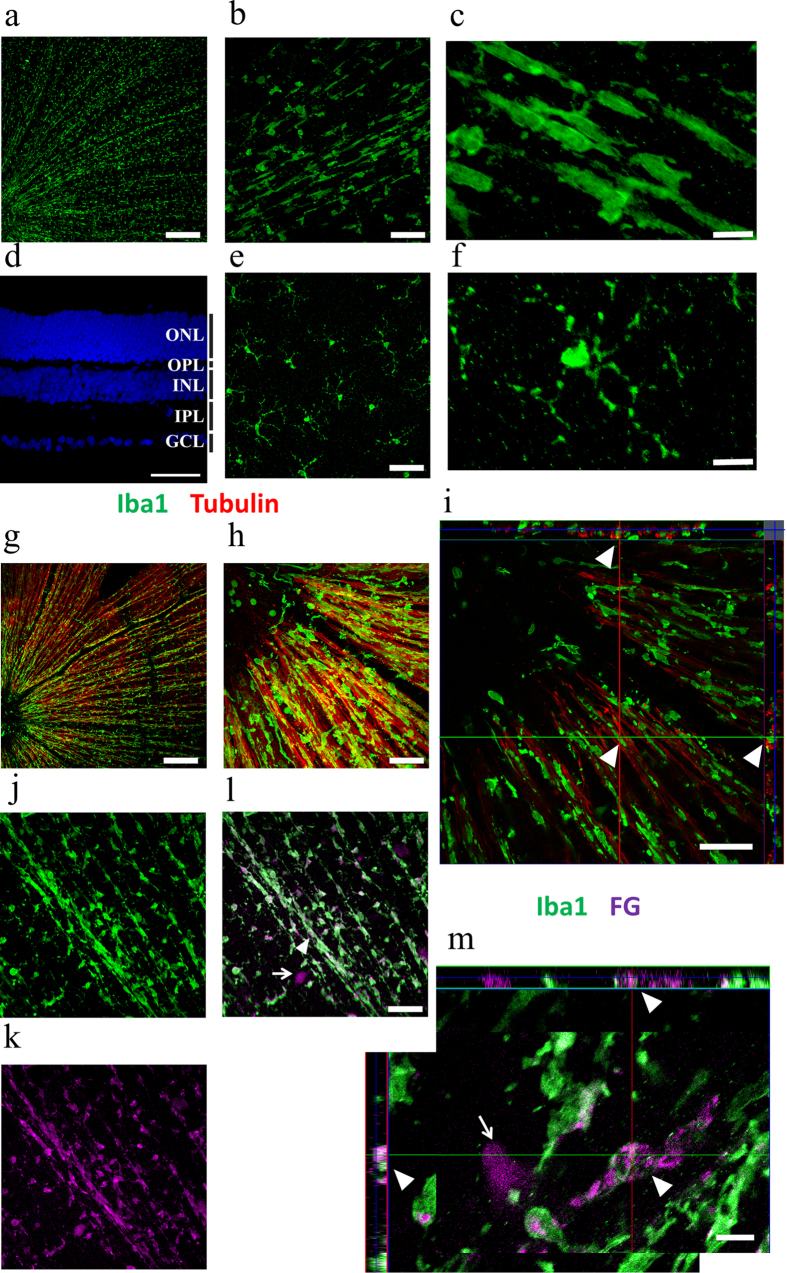
Figure 2. Rod microglia are specific to ganglion cell layer and are phagocytic.
a: Whole retina staining of Iba1 3 weeks after ONT. Scale bar: 200 μm. b: Rod-morphology microglia at ganglion cell layer (GCL) layer of retina. Scale bar: 50 μm. c: High magnification image of Rod-morphology microglia at GCL. Scale bar: 10 μm. d: DAPI staining of retina (view from laterally) showing different cellular layers. Scale bar: 50 μm. e: Resting morphology microglia at Inner nuclear layer (INL). Scale bar: 50 μm. f: High magnification image of resting-morphology microglia at INL. Scale bar: 10 μm. g: Whole retina staining of Iba1 (green) and tubulin (red) 2 weeks after ONT. Scale bar: 200 μm. h: Close relationship between microglial processes and the nerve fibers. Scale bar: 50 μm. i: Z-stack view of close relationship between microglial processes and the nerve fibers (white triangle). Scale bar: 50 μm. j, k and l: Whole retina staining of Iba1 (green, 2J) and Fluoro-Gold (FG) (purple, 2K) 2 weeks after ONT. 2L is the merged picture. The arrow shows a survived ganglion cell from ONT. Scale bar: 50 μm. m: Z-stack view showing that FG particles were phagocytized by microglia after ONT (white triangle). Scale bar: 10 μm.

