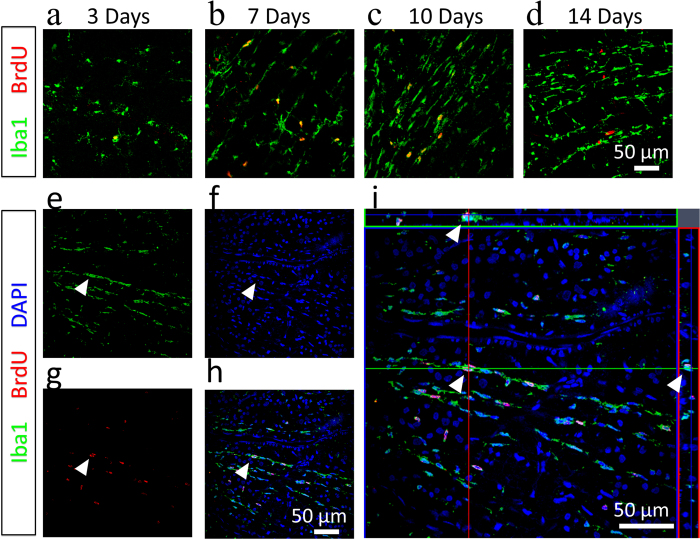
Figure 4.
Rod microglia are proliferating in situ. a, b, c and d: Whole retina staining of Iba1 (Green) and BrdU (Red) at 3 days, 7 days, 10 days and 14 days after ONT. Scale bar: 50 μm. e, f, g, and h: Co-localization of BrdU (red) and Iba1 (Green) staining in a microglial cell at 7 days after ONT (white triangle). Scale bar: 50 μm. 3I: Z-stack view showing the proliferating microglia cell (white triangle). Scale bar: 50 μm.

