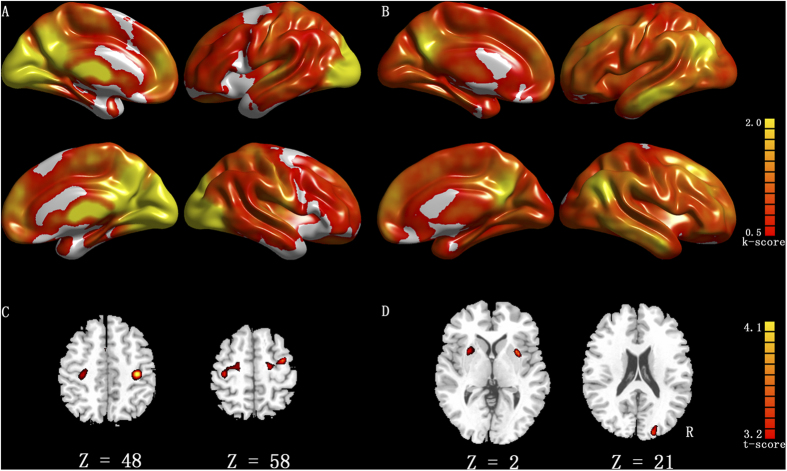
Figure 1.
Result of the FCD analyses. Row A and row B show the spatial distribution of the average short-range FCDs and long-range FCDs, respectively, superimposed on the cerebral cortex for all subjects. Row C represents increased short-range FCDs of dancer group compared with non-dancer group (p < 0.001, cluster threshold k > 600 mm3). Row D represents increased long-range FCD of dancer group compared with non-dancer group (p < 0.001, cluster threshold k > 600 mm3).

